Save
This View  and Add New View (Save As)
  - Click the respective buttons to save
the active view or create a new view from the active view.
The Save button will be disabled in certain cases, such as
for users who are running global views and have a casual or
advanced level
of access for the application. Those users cannot save
changes to global views, but they can use the Save As button
to save changed views as shared views or their own personal
views.
- Click the respective buttons to save
the active view or create a new view from the active view.
The Save button will be disabled in certain cases, such as
for users who are running global views and have a casual or
advanced level
of access for the application. Those users cannot save
changes to global views, but they can use the Save As button
to save changed views as shared views or their own personal
views.
Process Your Planning Changes  -
This icon only displays in the toolbar if the Planning property
for the view is set to Yes. After making planning changes
in a view, click this icon to update the Analysis Services
and Stratum storage databases for your environment with those
planning changes.
-
This icon only displays in the toolbar if the Planning property
for the view is set to Yes. After making planning changes
in a view, click this icon to update the Analysis Services
and Stratum storage databases for your environment with those
planning changes.
Export
to Excel  - Click to initiate an export
of the view and chart to Microsoft Excel. If
you choose to export the data as Excel Data instead of an
Excel Report, the view data will be exported but charts and
special formatting will not be exported. An Export Type property
controls the Data versus Report option, and you can control
that from Display Options or a Properties window in the view.
- Click to initiate an export
of the view and chart to Microsoft Excel. If
you choose to export the data as Excel Data instead of an
Excel Report, the view data will be exported but charts and
special formatting will not be exported. An Export Type property
controls the Data versus Report option, and you can control
that from Display Options or a Properties window in the view.
Print
This Page  - Click to print the active page of the view.
Email
This Page  - Click to access the window for emailing views.
Add
Charts  - Click to access a wizard for creating charts for the active
view.
- Click to access a wizard for creating charts for the active
view.
Edit
Display Options  -
Click to open the Display
Options window. Use
it to control properties
for the view grid. You
can control items such as whether or not row and column headers are locked, the page size of
the view, and the display of totals and all others values.
Save the view if you want your display changes to be retained
for the next time the view is run. From here, you also can
display how data is exported during Exports to Excel (either
Excel Data or Excel Report).
-
Click to open the Display
Options window. Use
it to control properties
for the view grid. You
can control items such as whether or not row and column headers are locked, the page size of
the view, and the display of totals and all others values.
Save the view if you want your display changes to be retained
for the next time the view is run. From here, you also can
display how data is exported during Exports to Excel (either
Excel Data or Excel Report).
Show
/ Hide View Explorer  - Click to show or hide
view explorer. This button does not display if you have a
casual level of access
for the application.
- Click to show or hide
view explorer. This button does not display if you have a
casual level of access
for the application.
Select
Parameter Values  - Click to access the View
Prompt window for parameters. This button only displays
if parameters exist for the view.
- Click to access the View
Prompt window for parameters. This button only displays
if parameters exist for the view.
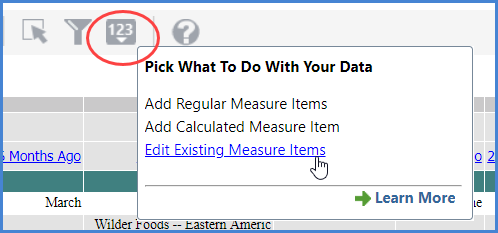
Manage
All Filters  - Click
to access the window for adding, clearing, or changing filters.
This filter icon will be red when there are active filters
in the view.
- Click
to access the window for adding, clearing, or changing filters.
This filter icon will be red when there are active filters
in the view.


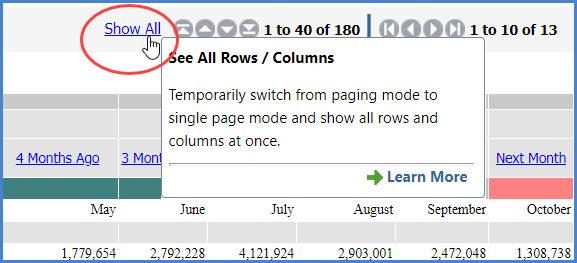
 - Use to open
or close the
- Use to open
or close the