The following table lists examples of when to use time ranges and when to use time hierarchies to achieve various types of time analysis in views such as YTD or Rolling N Periods analysis. In most cases, you can achieve the desired analysis using measure items with time ranges. In other cases, time dimensions are recommended. Views showing various examples are on the next few pages
Time Ranges used to… |
Time Hierarchies used to… |
|---|---|
|
|
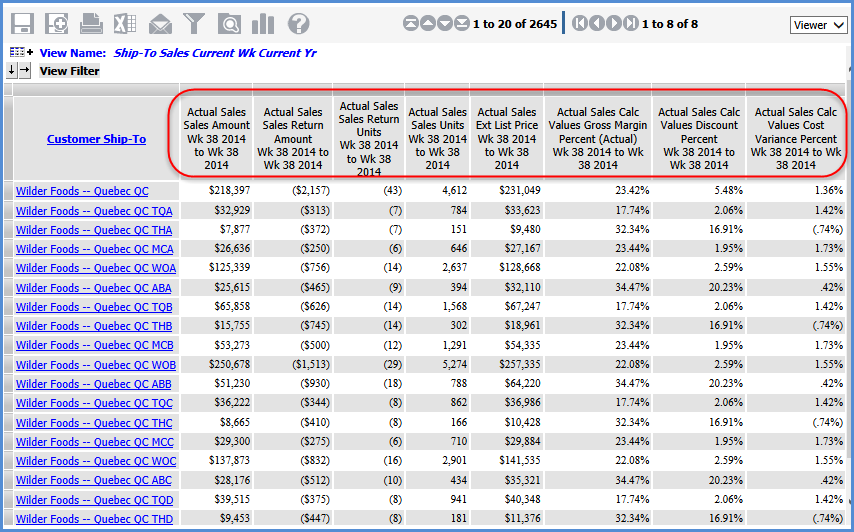
This view displays measure items based on different Actual Sales measures, and all are for the same point in time – the current week of the current year (in this case, Week 38 of 2014).
Time range properties selected for the measure items were:
This view displays measure items based on different Actual Sales measures, and all are for the same point in time – the weeks YTD for the current year (in this case, Week 1 through Week 38 of 2014).
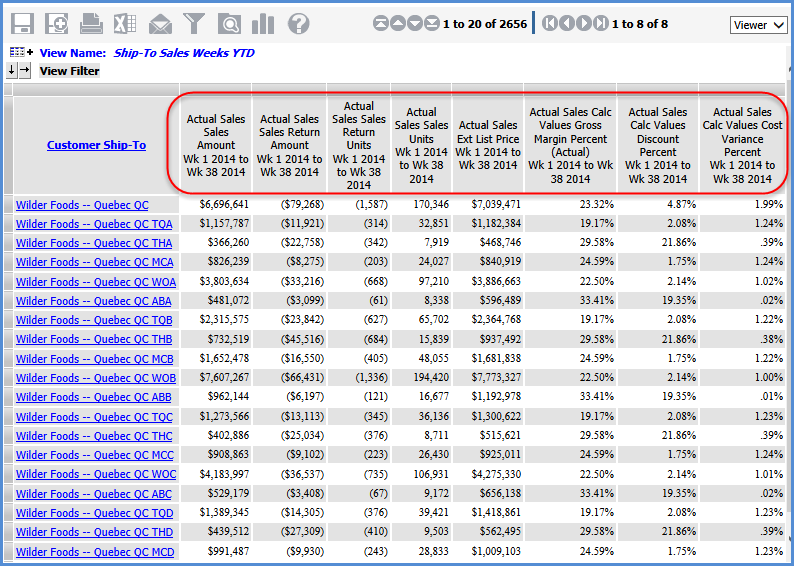
Time range properties selected for the measure items were:
This view displays measure items based on different Actual Sales measures, and all are for the same point in time – the three months prior to the current month of the current year (in this case, June 2014 up to the current month of September 2014).
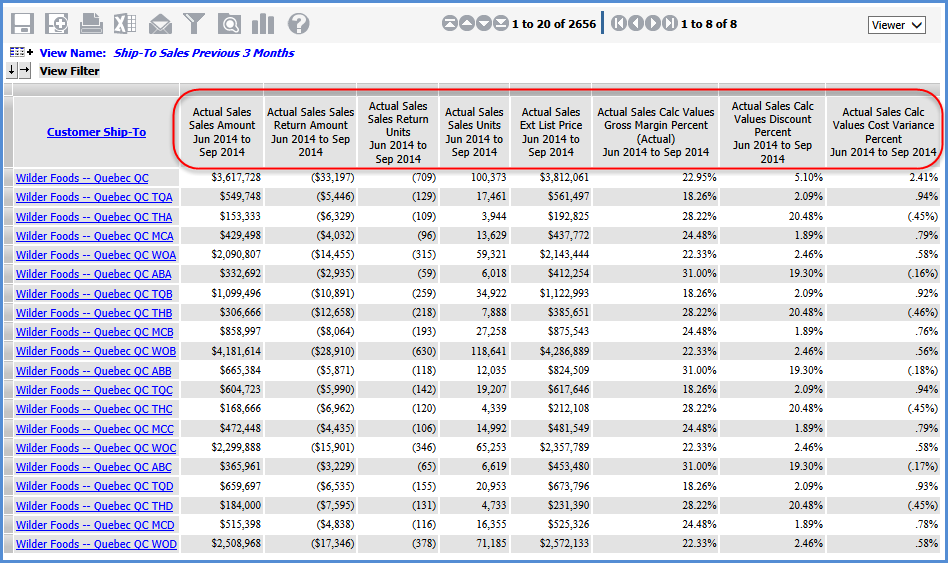
Offsets were used to define part of the time range for the measure items. The “From” point in time was defined by specifying a -3 offset to the Current Month of the Current Year. Here are the rest of the time range properties:
All the measure items in this example are based on the Daily Sales Daily Sales Units measure. The different points in time being analyzed are current week, current month, and YTD – in this case Week 38, September, and January 1 through September 15 of 2014.
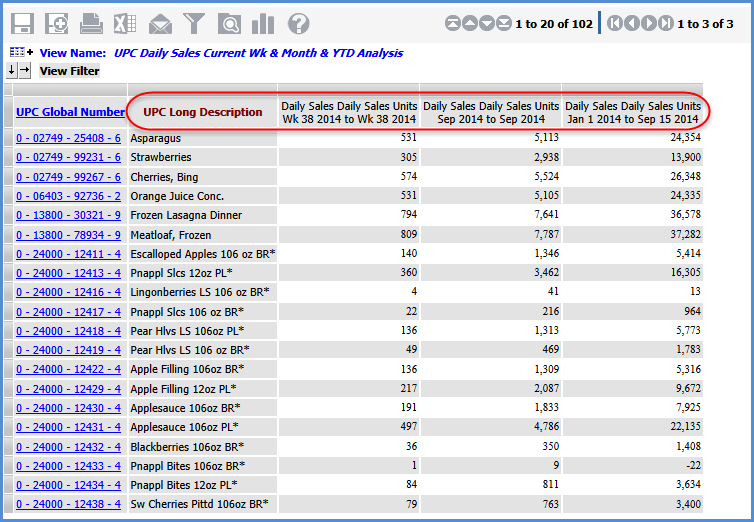
Time range properties for the current week were:
For current month:
For YTD:
The 4 regular measure items in this example are based on the Daily Sales Daily Sales Amount measure. The different points in time being analyzed are current month of last year and current year, and the YTD for last year and current year (in this case, September of 2013 vs 2014 and YTD 2013 vs 2014). Calculated measure items show the variance amount from last year to current year.
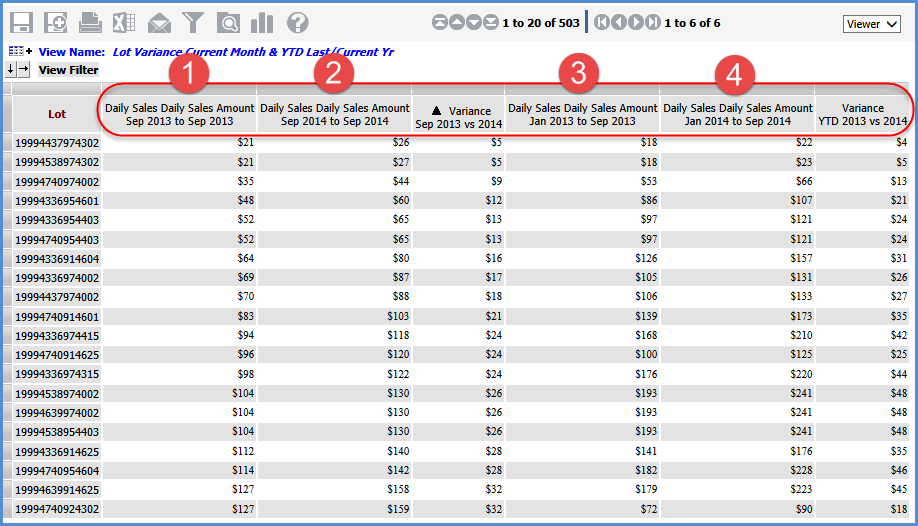
Time range properties for the current month of last year measure item were:
For current month current year:
For YTD last year:
For YTD current year:
All measure items in this view are based on the Actual Sales Sales Units measure. The same periods for several different years are being analyzed – Period 26 through 33 in 2012, 2013, and 2014. That type of analysis is helpful for comparing unique periods of time year by year, such as comparing seasonal sales promotions year by year.
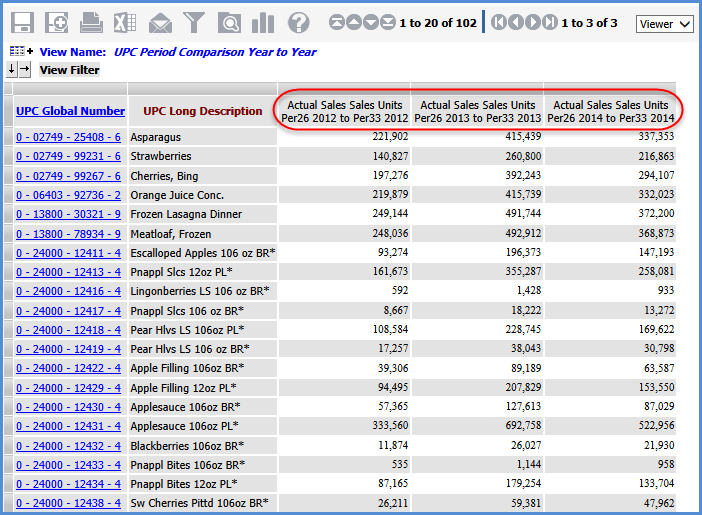
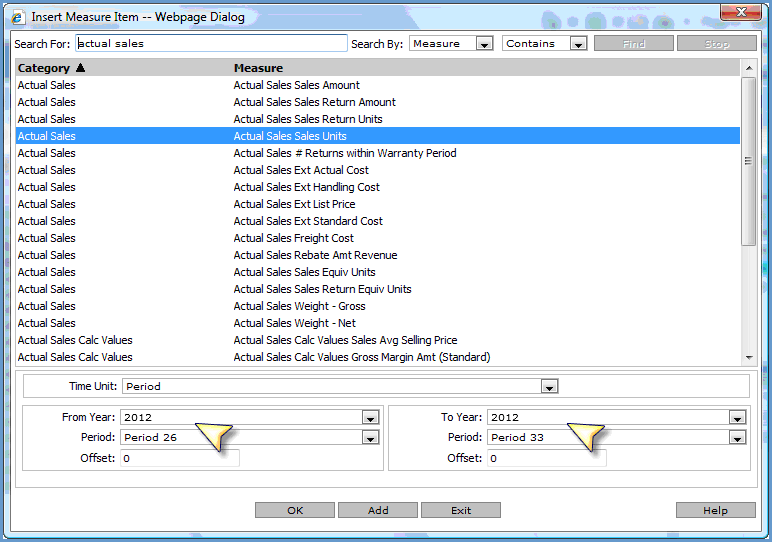
Time range properties for the 2012 measure item were as follows. The other two measure items used the same properties except for 2013 and 2014 as the From Year and To Year.
This view shows 12 rolling weeks of sales data, for the current week and 11 prior weeks. In this case, that is Week 38 back to Week 27 of 2014.
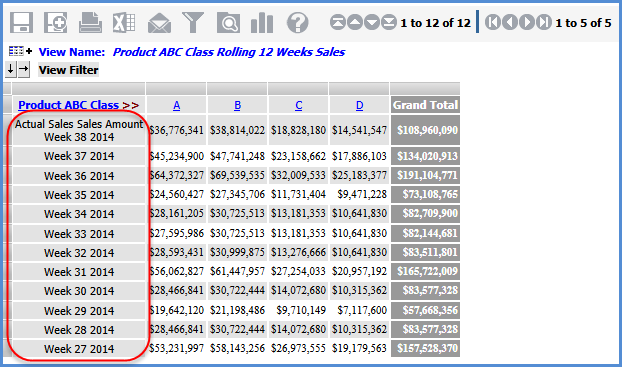
Time range properties for the current week were:
Offsets to the Current Week of the Current Year were used to create the rest of the measure items. For example, the From and To offsets were both set to -1 for the prior week measure item (Week 36), were set to -2 for the 2 weeks ago measure item (Week 35), and so on through using -11 From and To offsets for the 12 weeks ago measure item (Week 26).
This view shows budget data by month for the current year only – January through December of 2014.
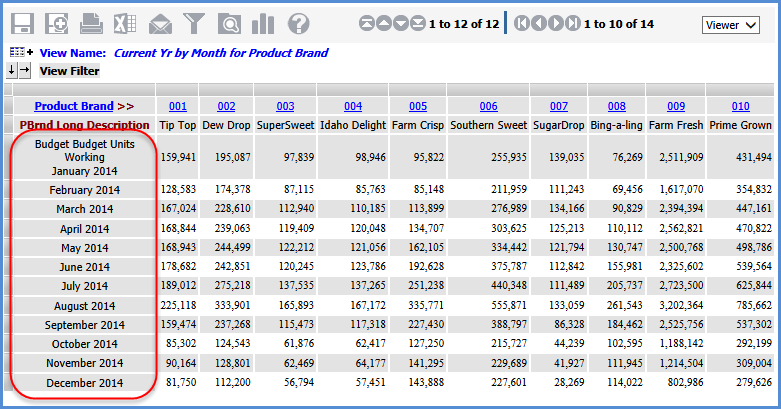
Here are the first measure item’s properties. Subsequent ones were created by changing the month to February, March, April, and so on.
The two examples that follow use time dimensions and regular measure items to show trending results. For an example that uses Tuple calculations with time dimensions to create a month by month comparison, see Use Tuple-Based Calculations To Compare Current Year Vs. Last Year By Month.
This trending view shows data for the last year and current year by month. That analysis is achieved using Months from the Months hierarchy on rows and Year Based from the Year Based Months Based hierarchy on columns.
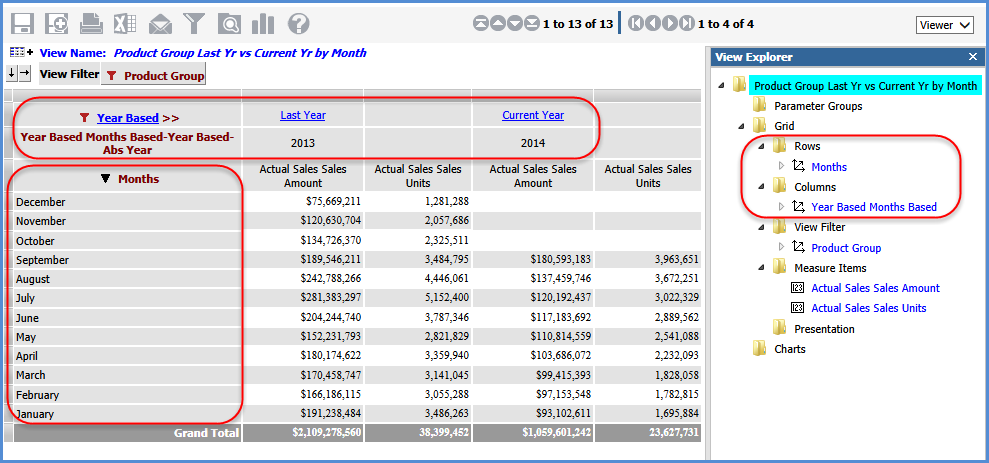
The Time Range property for the view is No, so the measure items don’t have any time range properties.
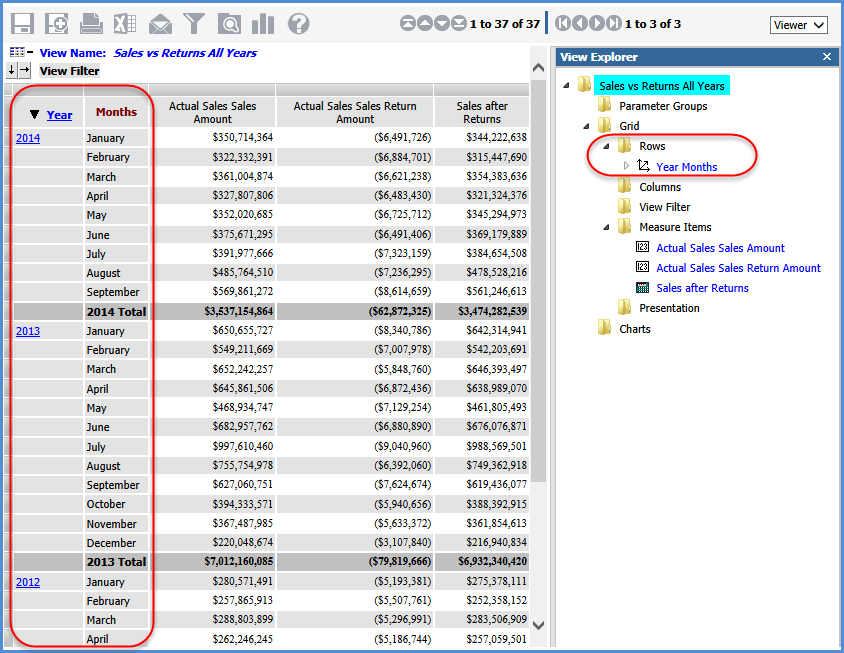
This trending view shows data for all years by month for sales and returns. That analysis is achieved using the Year Months hierarchy on rows, drilled down to Months. As with the previous example, measure items without time ranges are used in the view. A calculated measure item shows net sales after returns.