How do you compare this year vs. last year with months going down the side of a view and see the % of sales ratio? We get this question from time to time and it’s pretty easy to do. You could do this by describing 24 separate measures and then adding 12 more for a total of 36 that do the calculation between the last year and this year sales. But there is an easier way!
All you need to do is use time as a dimension (or in Stratum terms – set Time Range to No for its measure items) and create three measures that you want to repeat for every month (or week or any other time unit you choose).
Note: See Example 2 if you prefer to see Months across the top of a view in columns rather than down the side of a view in rows.
First – what do you mean – use time as a dimension? This allows you to have measures that automatically repeat for each time unit displayed. Simple example would be displaying sales and units for each month of a year or weeks or days.
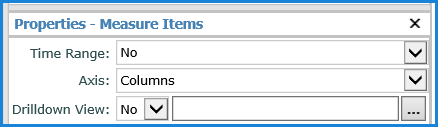
To start – you have to set Time Range to No – this is a property of the Measures Items node in the View Explorer. Easy to do, just right click on Measures Items node in the view explorer window and select Properties – then change the Time Range to No (the default is Yes.
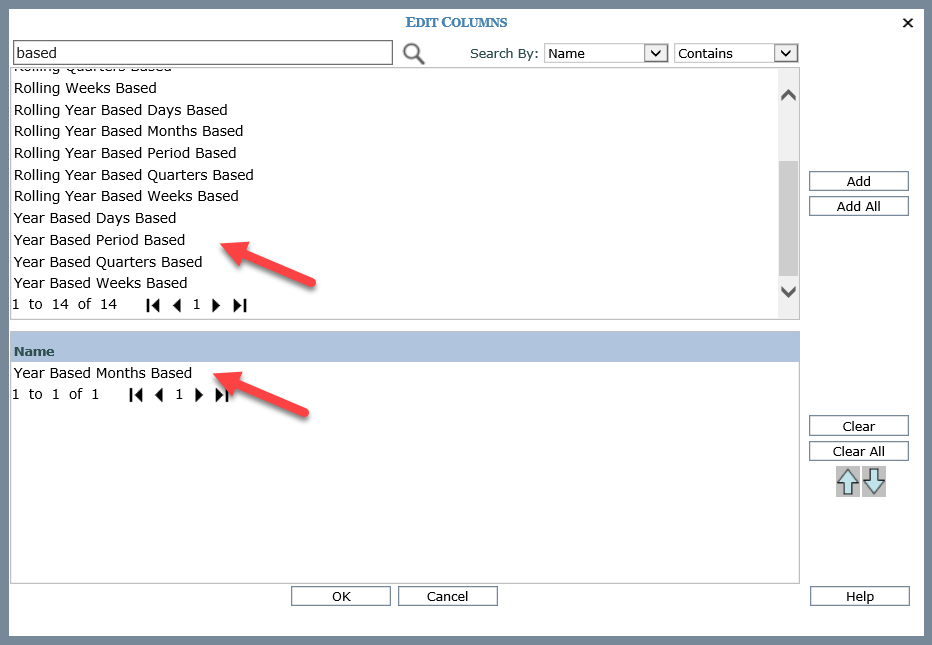
Once you've taken care of setting Time Range to No, you’ll want to include some Time in your view. So instead of having time controlled by column (as in a ‘typical’ view where you select the from and to time for each measure) we are going to have each measure repeated for every time unit we select. In this example, we have years and months. It's always recommended using Based time dimensions like Year Based Months Based since these based (or relative) time dimensions allow you to select Current Year (CY) and Last Year (LY) and will automatically switch years when the year changes. Same with the months – Current Month, Previous Month, etc.
Finally, you add some measures and set up a few calculations. The next two examples show this type of view and the specifics of the calculations that were set up.
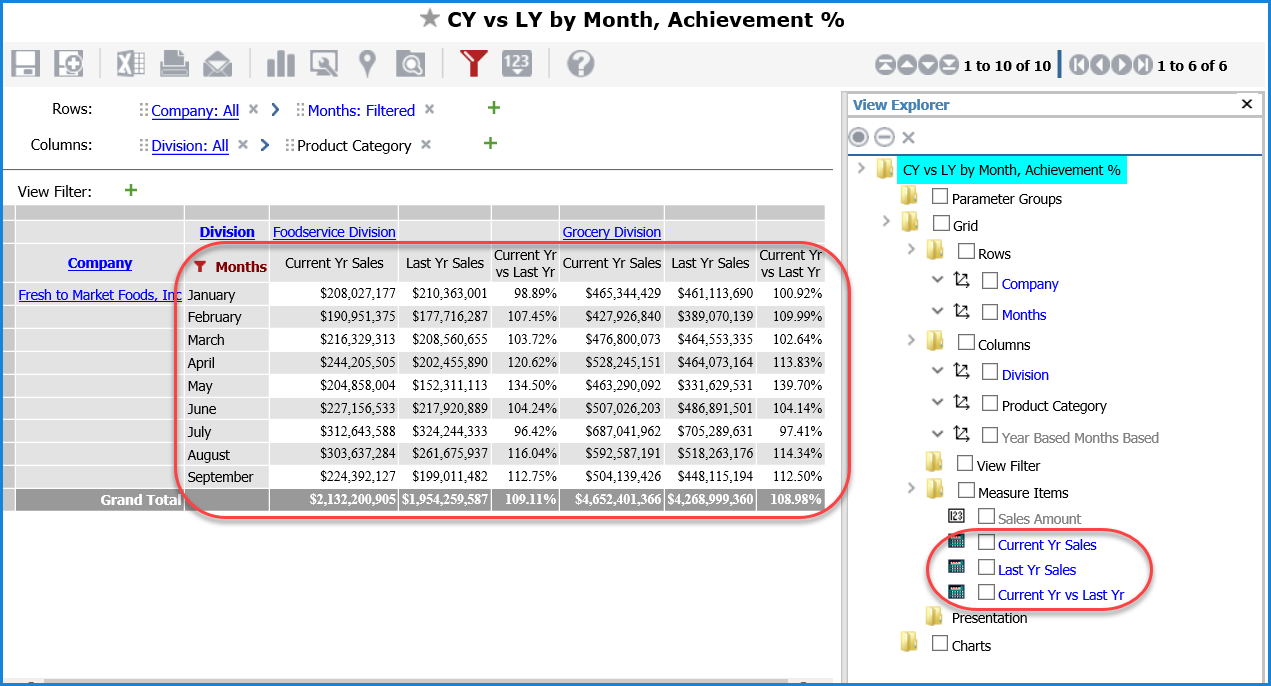
In this example, we used the Year Based Months Based dimension as a hidden dimension (used in our calculations) and the Months dimension. Then we added a Sales Amount measure item as a hidden measure item (used in our calculations), did a couple of calculations to get Current Year (CY) and Last Year (LY), and then we created a % calculation between CY and LY. If we were interested in just a single year – we could just show the Sales Amount measure in the view and we’d be done. But because we are going to select a couple of years, we need to create a simple calculation that filters our CY and LY sales. These calculations are called ‘Tuples’. The calculations are described after this image.
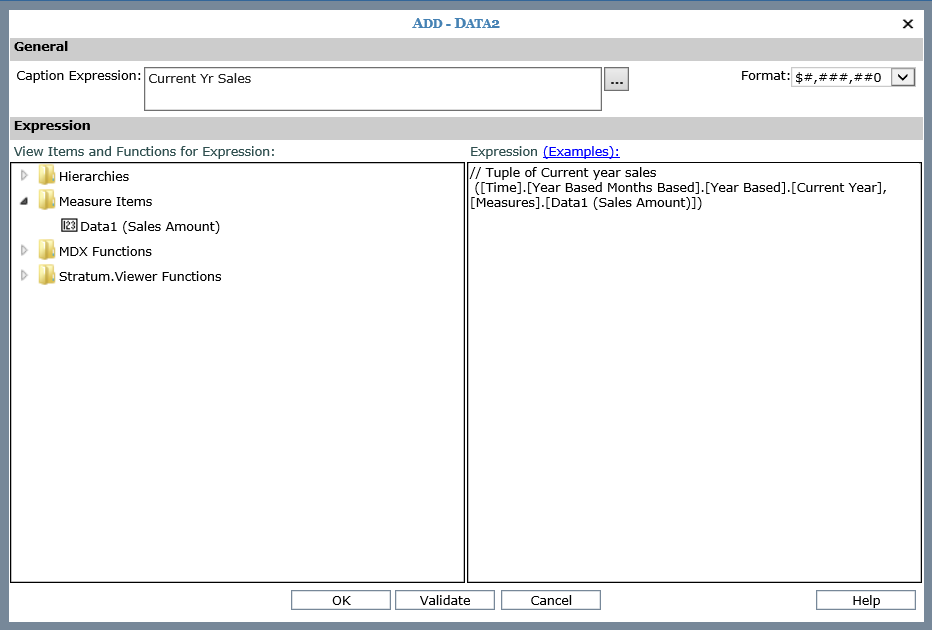
The calculation for Current Year looks like the following. The text preceded by // is comment text that describes the calculation, and it gets ignored by Viewer. The [Time].[Year Based Weeks Based].[Year Based].[Current Year] is from the dimensions – this is filtering the Time dimension to show only the Current Year. The [Data1 (Sales Amount)] is the Sales Amount measure we want to see. Put a comma between them and add a parenthesis mark at the front and back and you’ve got yourself a Tuple.
// Tuple of Current year sales
([Time].[Year Based Months Based].[Year Based].[Current Year],[Measures].[Data1
(Sales Amount)])
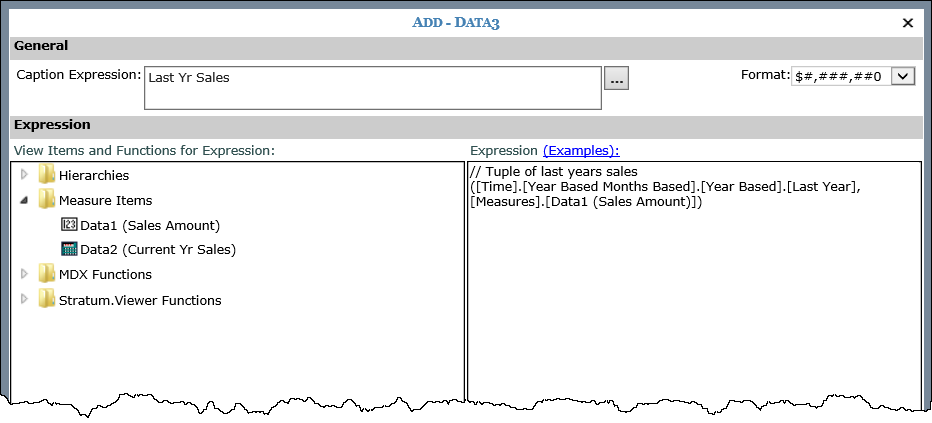
Next, we created the same calculation
for Last Year:
// Tuple of last years sales
([Time].[Year Based Months Based].[Year Based].[Last
Year],[Measures].[Data1 (Sales Amount)])
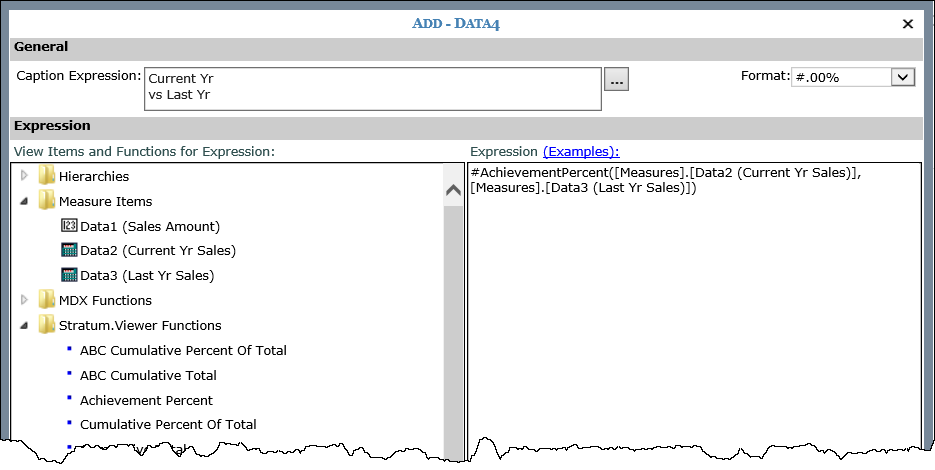
Finally, we created a calculation to do the % calculation using a Stratum function – we used that function so that the divide by zero check is automatically handled. There are some helpful functions in the Stratum.Viewer Functions area of the calculation window, so check them out. You can add formatting and captions too as you set up your calculations using shortcuts in this window.
#AchievementPercent([Measures].[Data2 (Current Yr Sales)], [Measures].[Data3 (Last Yr Sales)])
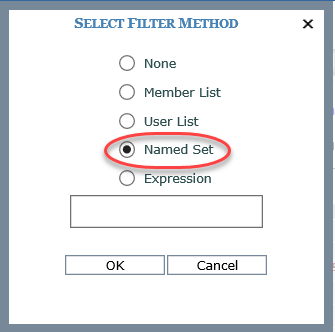
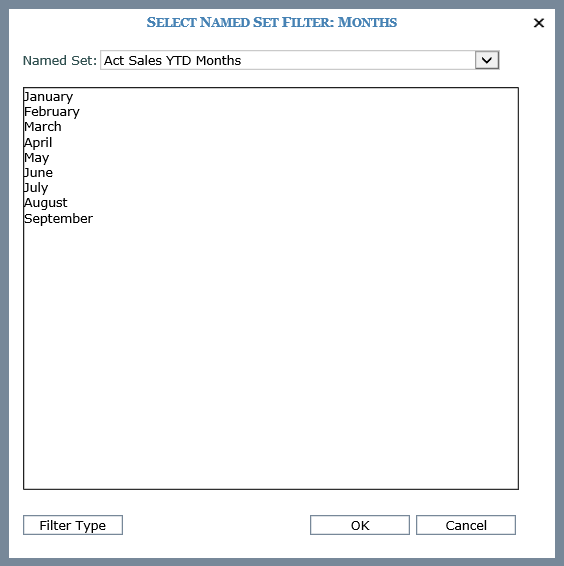
Another helpful technique used in this example is to limit the months of data that get displayed so the view automatically only shows months thru the current month – that way, the future months without sales don’t show up (which is nice when comparing CY to LY particularly in a chart). You can do that using a filter on time such as a Named Set filter. Named sets are available for the Time dimensions like Months, Weeks and Days (without any Year associated with them). Named Sets are a list of time units (Months, Weeks, Days normally) that Stratum automatically updates to include months from the beginning of the year thru the current month. In this example, we right-clicked the Months dimension in the view, then selected Filter and Change Filter Type from the grid pop-up menu. Then we picked Named Set from the Select Filter Method window and picked a sales Named Set since our view is about sales. There is a Named Set for each type of monthly data (sales, budget, etc.).
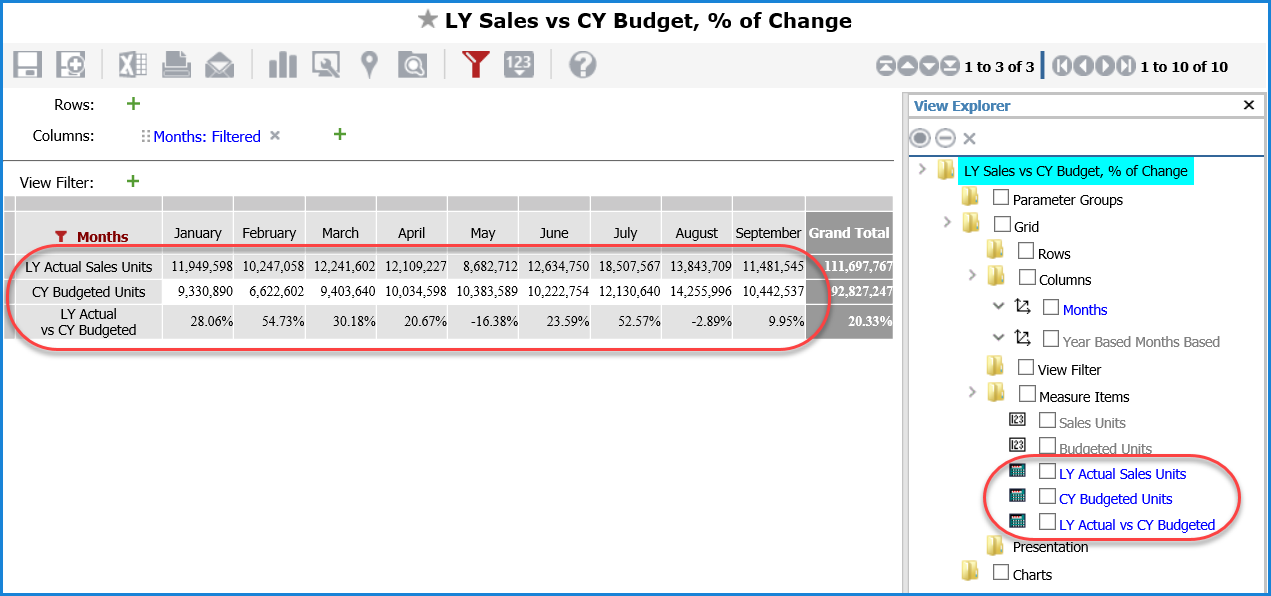
Here's another example using Tuple-based calculations. The layout of this view is slightly different from prior example. We have Months going across the top on columns while the measure items we're comparing are down the side on rows. Notice too we're comparing Sales against Budget from different years. The calculations help us compare the percent of change between Actual Sales Units from one year to Budgeted Units for a different year. Expressions for the three calculations follow this image.
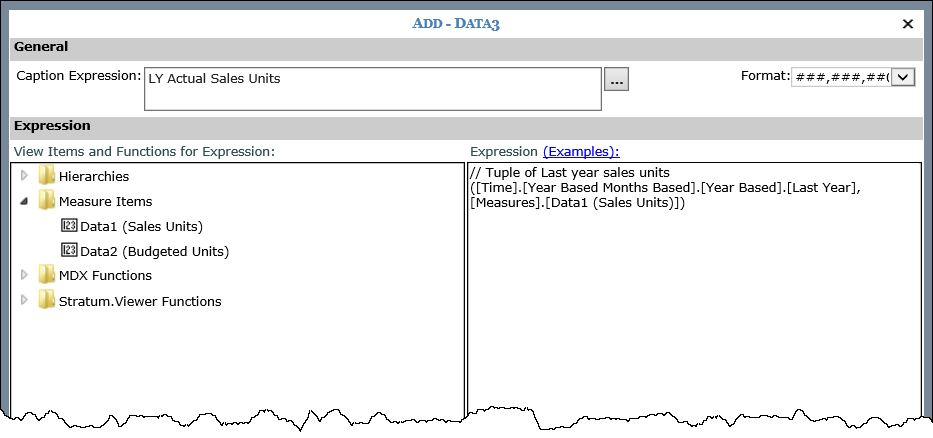
Here is the calculation used for Actual Sales Units for last year.
// Tuple of Last year sales units
([Time].[Year Based Months Based].[Year Based].[Last Year],[Measures].[Data1 (Sales Units)])
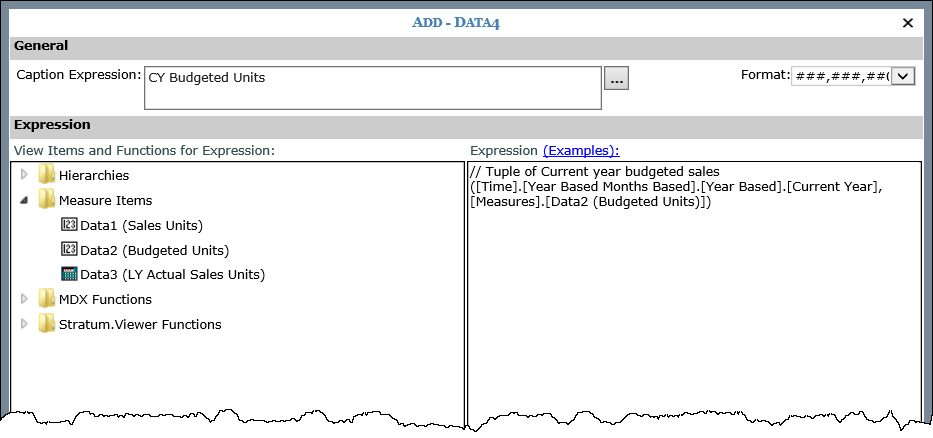
Here is the calculation used for Budgeted Units for the current year.
// Tuple of Current year budgeted sales
([Time].[Year Based Months Based].[Year Based].[Current
Year],[Measures].[Data2
(Budgeted Units)])
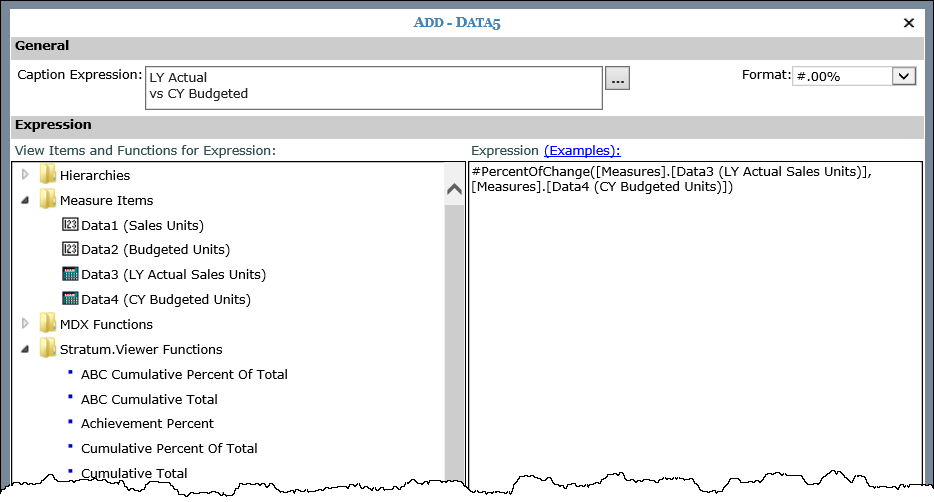
Here is the calculation giving us the % of change between LY Actual Sales Units and CY Budgeted Units. We used the #PercentOfChange function from the Stratum.Viewer Functions folder for this calculation.
#PercentOfChange([Measures].[Data3 (LY Actual Sales Units)], [Measures].[Data4 (CY Budgeted Units)])