See also Grid Toolbar.
|
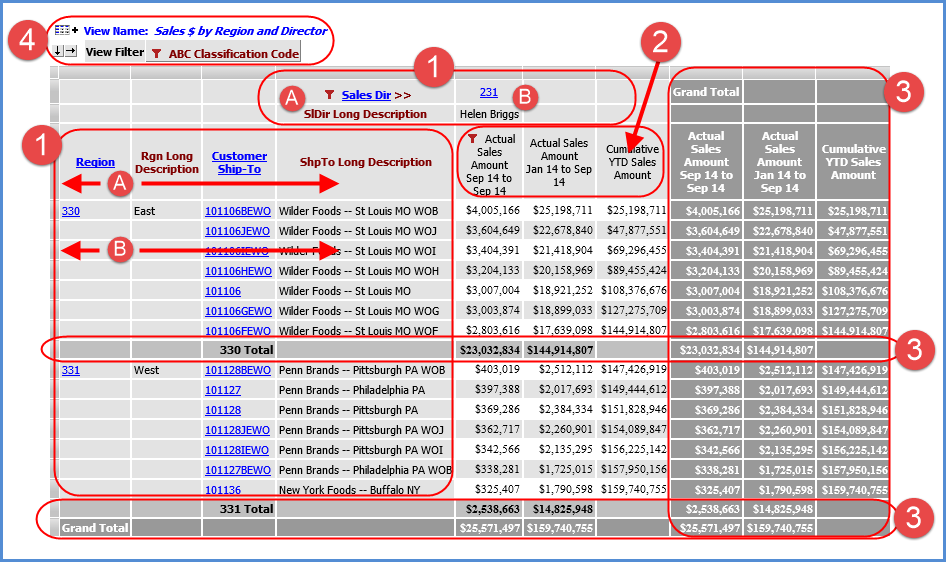
Rows and Columns - The grid displays levels along the rows and columns axis. You can create views with levels on one axis (rows or columns) or levels on both axes.
|
|
Measure Items - Measure items can be assigned to one axis, either rows or columns. If you create any distinct calculated measure items, you can position them before all other measure items or after all other measure items.
|
|
Totals - Grand totals and sub-totals are displayed in darker grey rows and columns. Totals can be displayed for some, all, or no objects in the view. You can control totals by measure items, individual levels, or an entire axis. Grand Totals that are on the same axis as measure items can be sorted and filtered. |
|
View Name - Displays the view name. Right-click to display actions that you can take related to the overall grid, such as exporting to excel. See Grid Pop-up Menus. Expand View Axis Icons - An icon exists for rows
View Filter - If you used this section to apply a filter to the entire grid, levels used in the filter will display here. See Apply a View Filter.
|

 Header Cells -
  Detail Cells -
 . Pop-up labels display the sort and filter details
when the cursor is moved over the respective icon. See also
. Pop-up labels display the sort and filter details
when the cursor is moved over the respective icon. See also