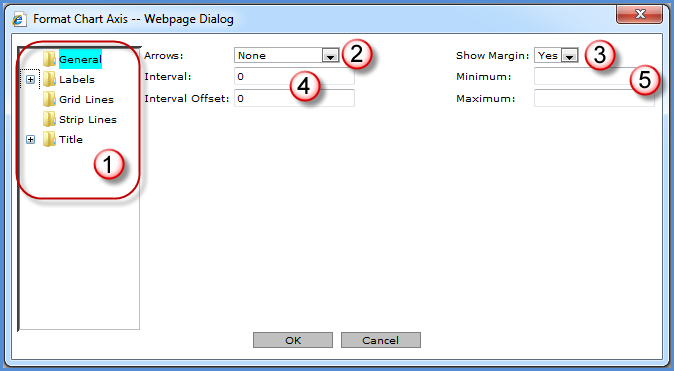
You can control the format of both the vertical and the horizontal axis. The state of the following windows depends on the folder selected in the left side of the window:

|
The chart characteristics being maintained depend on the folder selected. Changes can be made on all the various folders and then saved to the view. |
|
Arrows - Use this field to place an arrow on the axis. Valid selections are None, Lines, Sharp Triangle, and Triangle. |
|
Show Margin - Use this field to manage the space between the first and last value. Selecting No removes unused space on the chart axis.
|
|
Interval - Controls the frequency that the grid lines appear for the axis. For non-numeric axes, a selection of 1 indicates that the lines display for every value. A selection of 2 indicates the lines display on every other value, and so forth. For numeric axes, enter an appropriate interval based on the scale of the chart. If values range from 100 to 1,000, an interval of 100 would be an appropriate value. Interval Offset - Determines where the first grid line appears. For numeric axes, enter the value where this first grid line should display. For non-numeric axes, enter the number of the value collection where the first grid line should appear. Note: If zero, then the charting wizard will determine the appropriate interval and interval offset for the chart. |
|
Minimum - Defines the minimum value of the axis. If blank, then the charting wizard will determine the minimum and maximum values based on the chart content. Maximum - Defines the maximum value of the axis. |
|
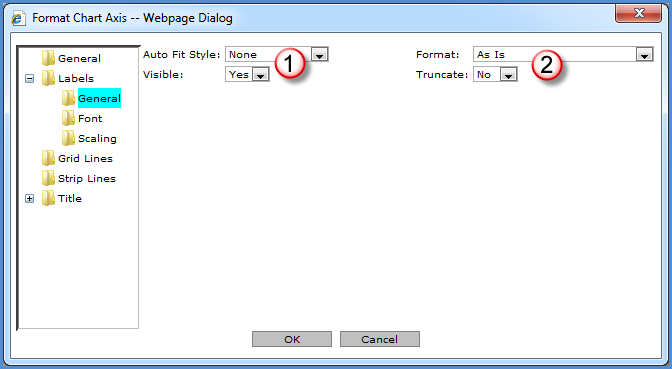
Auto Fit Style - Controls the positioning of the axis labels. Charting wizard validates the selection and ultimately determines the best style to use. Valid selections are shown below:
Visible - Controls whether or not the axis labels are visible. |
|
Format - Select from options like #.00, #.00%, and As Is to determine the format of numeric axis labels. Truncate - Choose Yes to shorten the labels when there is not enough room for them to display. By default, the labels are not truncated. The charting wizard validates selection and ultimately determines the extent to which the label is truncated. |
|
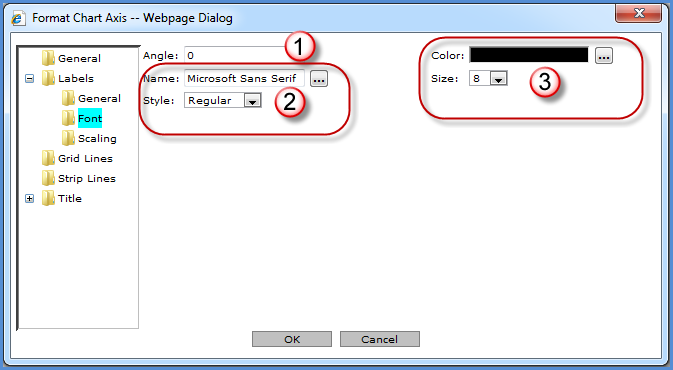
Angle - Enter an angle number at which the axis labels are to display. Valid range is -90 to 90. If Auto Fit Style was not defined on the General folder, the angle entered here is always applied. If Auto Fit Style was defined, angle entered here may be used if the charting wizard determines the auto fit angle would not be properly displayed. |
|
Name -
Choose the font type for the axis. The Browse button Style - Choose whether the axis label is bold, italic, underline, or regular font. |
|
Color -
Choose the color of
the axis label font. The Browse button Size - An axis font size of 12 or less is recommended. |
|
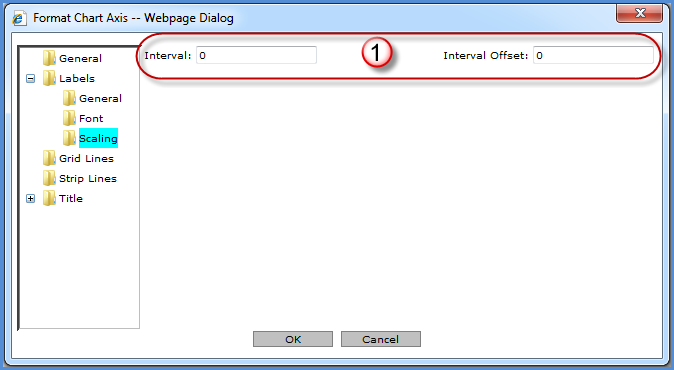
Interval - Controls the frequency that the labels appear for the axis. A selection of 1 indicates that the labels display for every value. A selection of 2 indicates the labels display on every other value, and so forth. Interval Offset - Determines where the first label appears. Note: If zero, then the charting wizard will determine the appropriate interval and interval offset for the chart. |
|
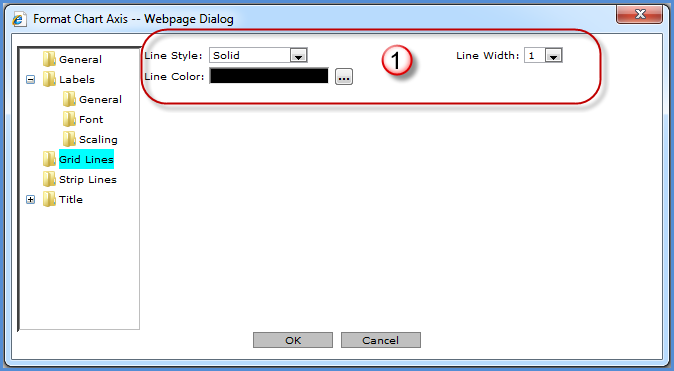
Line Style - Defines the style of the grid lines for this axis. Styles to choose from are Dash, Dash Dot, Dash Dot Dot, Dot, None, and Solid. You must select a color for the specified border style to be visible. Line Width - Specify a width of 1 to 10 for the axis grid lines. Line Color
- The Browse button |
|
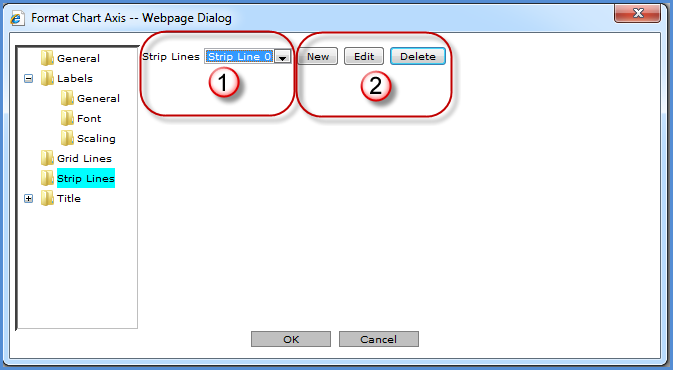
Strip Lines – Select a strip line from the drop down list to highlight some information included in the chart. For more information, see Format Chart Axis Strip Lines.
|
|
New - Access the Format Chart Strip Line window so a new strip line can be defined. See the Format Chart Axis Strip Lines topic for more information. Edit - Edit the selected strip line. Button only available when a strip line is selected. Delete - Delete the selected strip line. Button only available when a strip line is selected. |
|
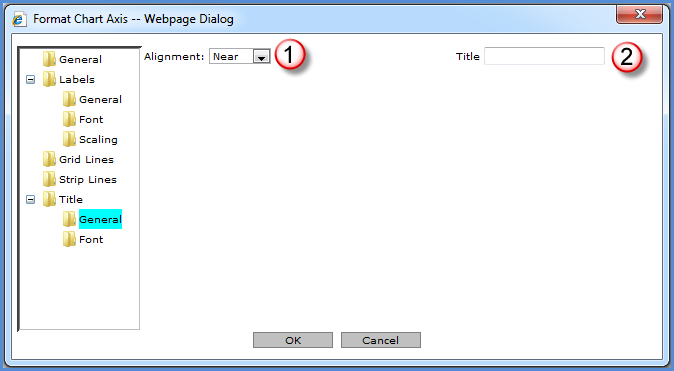
Alignment - If a title is included, you determine where it will be positioned. Valid options are Center, Far, and Near.
|
|
Title - Enter a caption labeling the axis. |
|
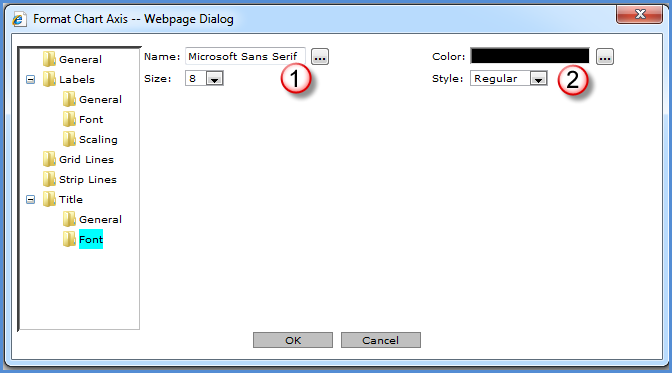
Name
- Choose the font type for the axis title. The Browse button Size - An axis font size of 12 or less is recommended. |
|
Color -
Choose the color of
the axis title font. The Browse button Style - Choose whether the axis title is bold, italic, underline, or regular font. |