The first step in prepping for a data import with Excel spreadsheets as the source is to collect your data into an Excel file. Familiarize yourself with the following tips and revisit this topic for guidance while setting up Excel import files for Data Imports.
Note: If you’re using CSV or text files or tables in SQL databases as the source of your import, see the topic Tips For Using Other Types Of Import Sources.
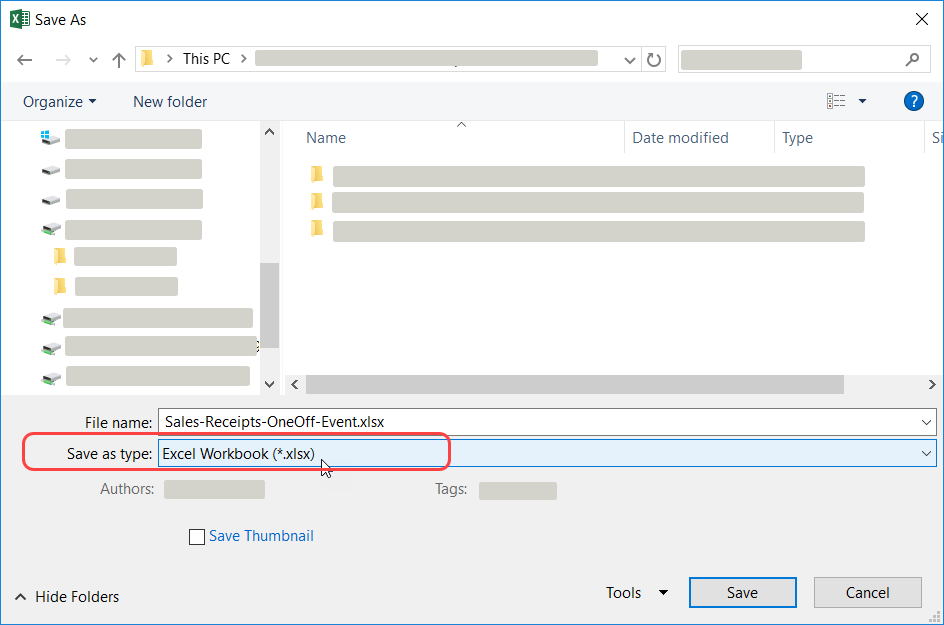
Save your file as an Excel Workbook file type and to a location that you can access while signed onto Stratum.Viewer. Avoid using the Strict Open XML Spreadsheet file type.
Your import must contain dates, dimensions, and measures – all of which tell Data Import where the data gets imported to in Stratum.
Dates – Dates are transactional details about your import.
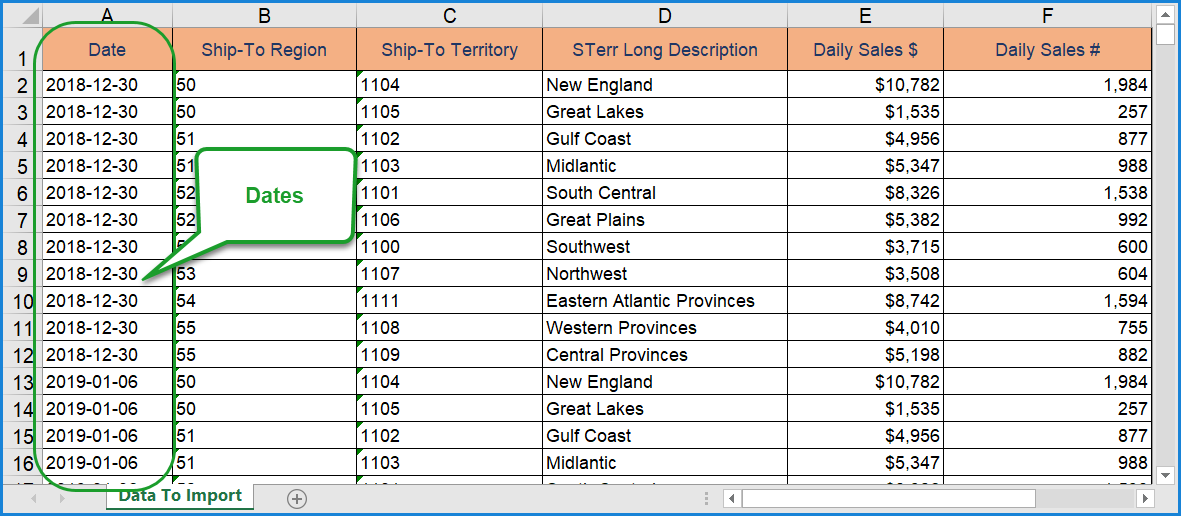
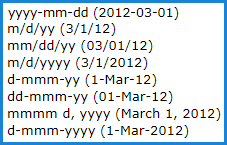
Dates must include the month, day, and calendar year. Also, they must all be in the same format. A mix and match of different formats isn’t allowed in the same import file. Your dates can be in one of the following formats:
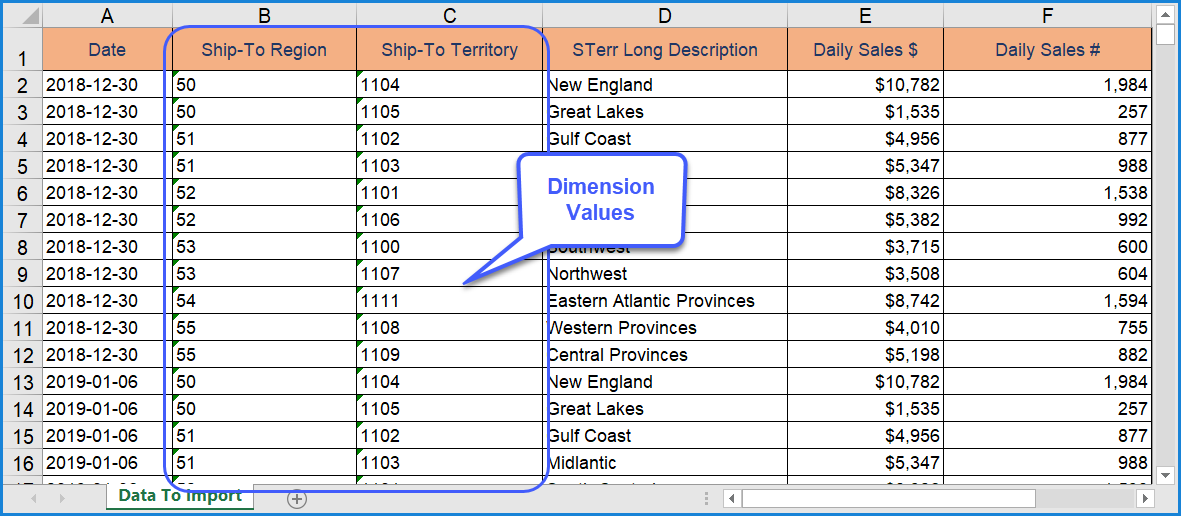
Dimensions – Dimensions tell Data Import where measure data belongs when it is imported. Examples of dimensions are Product, UPC, and Customer Ship-To. Dimension columns must contain the dimension values and not descriptive info (also known as PUF’s or attribute relationships). If your import contains columns of descriptive info, you can tell Data Import to ignore the columns.
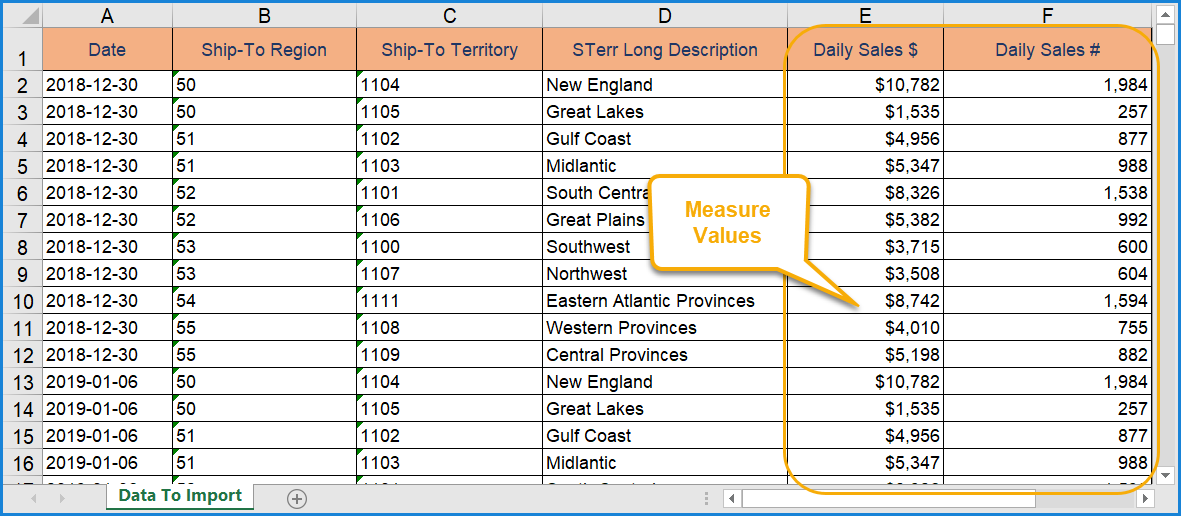
Measures – The detail data you are importing are the measures. This could be sales event dollars and units, budget data, marketing plan figures, one-off event items, receipts details, vendor details collected from the web, or other types of statistical data about things like weather patterns, housing and building trends, and other types of economic indicators.
Measure data must belong to the same category. For example, your file should only have data intended for a Forecast category or POS category but not both. Imports handle a single category at a time.
Some tips about setting up the measure columns in your import file:
For imports where dates are in every row (known as a Transactions type import), make sure each set of measure values you plan to import is contained in its own dedicated column and not spread across multiple columns. For example, put all sales amount data in a single column and all sales units in a separate column.
For imports where dates are in a header row (known as a Time Series type import), make sure each combination of dates and measures get a dedicated column and represent a unique combination. For example, put all values for a 01-01-20 import of sales units into a single column under that date. Multiple columns with the same date can’t be mapped to the same measure.
Format any negative numbers with either a negative sign in front of them or with parentheses marks around them such as -1,467 or (1,467). Don’t use just a special color like red to format your negative numbers. At a minimum, use a negative sign or parentheses marks for them.
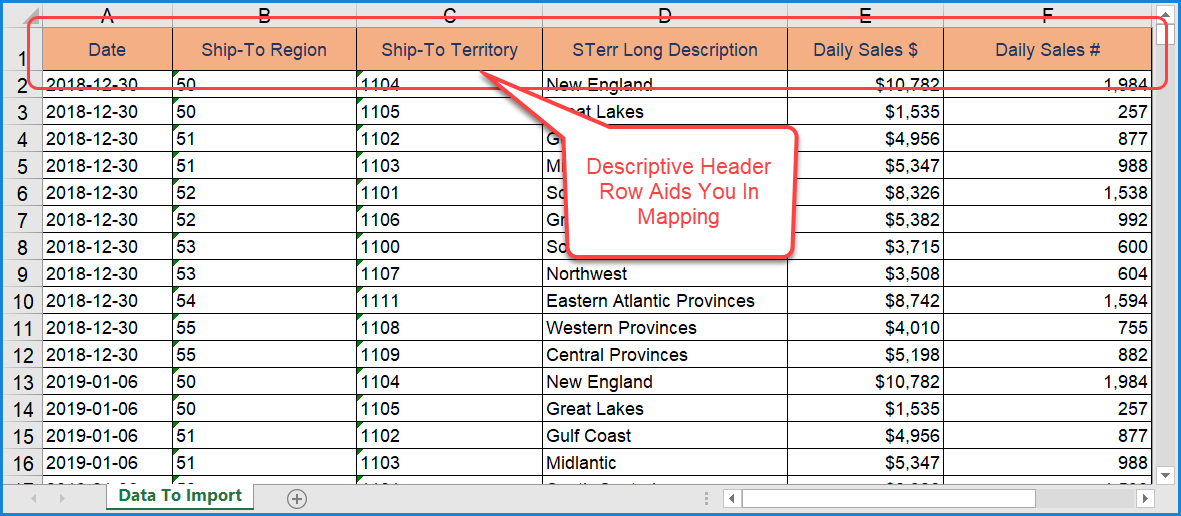
Identifying information about the data contained in each column of your file can be included in the header row(s) of your import file. They help identify what’s in each column – saving you time as you map columns or mark them to be ignored while setting up your import. Using header rows is optional for the Transactions import type (the type where dates are in every row). A minimum of one header row that contains dates is required for the Time Series import type (the type where dates are in a header row). A maximum of 99 headers rows can be included in either type of import.
The example shown in the next image uses one header row. You can use more than header row if needed. All header rows must be located at the top of your file, above the rows of import data.
Tip: Using the word “Date” in the header of the column that contains the transaction date helps Data Import automatically map that column as a date column.
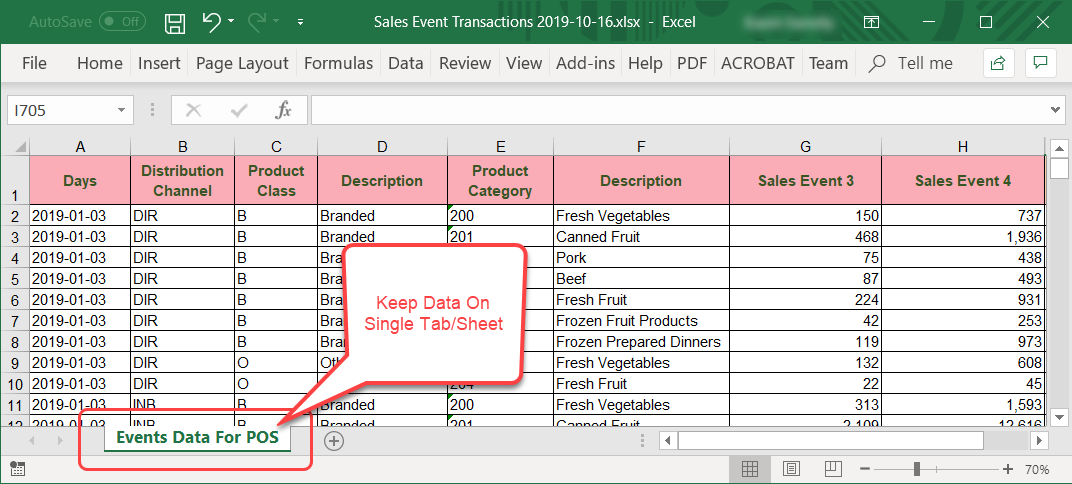
The data for your import needs to be in the first worksheet or tab of your import file. Only the first worksheet or tab is considered by Data Import and all others are ignored.
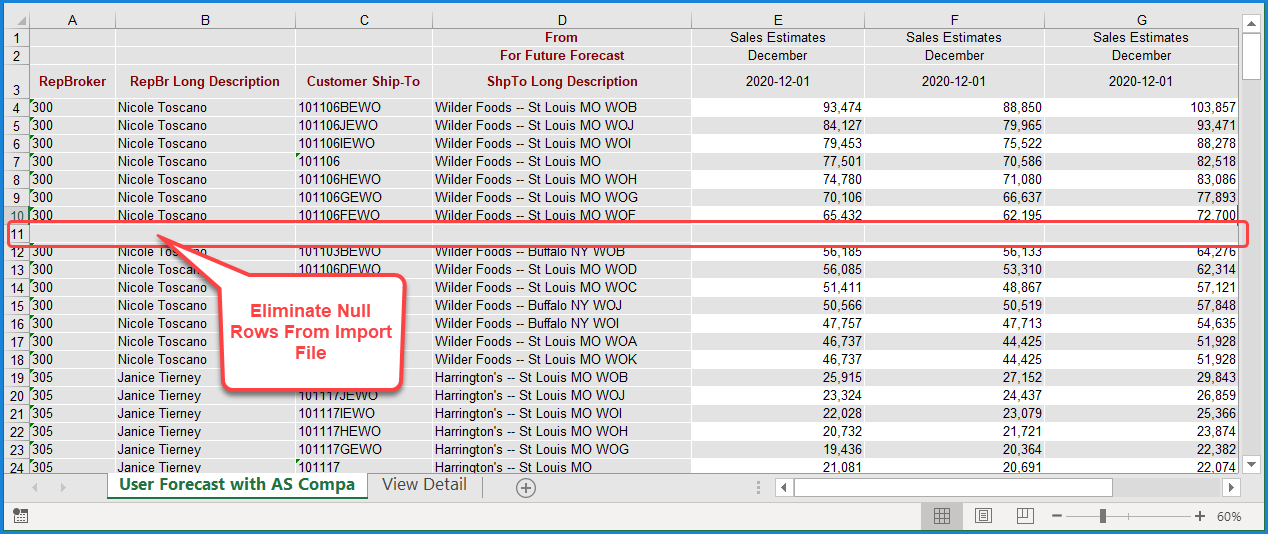
Make sure you don’t have a null row interspersed with rows of data in your import file. A Null row is a row without any data (note that a cell with all blank spaces or with zeroes in it is not considered null). The first null row that Data Import encounters in an import file will be treated as the end of your file. Data Import stops looking for data to import once it finds a null row. In this example, you’d want to remove row 11. If you don’t, the import will stop at that row and not consider any of the rows of data after that point.
Certain types of information should be excluded either because it doesn’t make sense for an import, isn’t necessary for an import, could disrupt the upload process, or could throw off the integrity of the import such as bring in unwanted data.
Exclude grand totals and subtotals. Only include detail data in import files. Importing subtotal and total data would duplicate other data in the import.
Delete any hidden rows from the Excel file, otherwise they will show up in the data import preview and be included in the data that gets imported. If you don’t want data from hidden rows, delete the rows from the Excel file before you import it.
Delete hidden columns from the Excel file, otherwise they will show up in the data import preview. If you don’t want data from hidden columns included in your import, delete the columns from the Excel file before you import it OR mark the columns as Ignore when mapping the data.
In cases where you use
an exported Stratum.Viewer view as the starting point when creating
an import file, it is recommended that you disable or exclude
the following Viewer features before exporting the view.
“All Others” rows or columns related to filtering.
Conditional format icons or formatting.
Charts.
Hyperlinks.
Calculated measure items that return images.
Pop-up labels on measure items.
Drilldown views linked up to rows, columns, or measure items.
Also consider excluding specialty Excel items like the items listed below.
Images.
Charts.
Cell borders.
Comments or notes.
Excel features such as Pivot tables and text boxes.