Click to see example expressions for the type of item you are working with in Stratum.Viewer.
The following examples show an axis filter that uses just measure items and an axis filter that uses a measure item and an attribute relationship. A table containing more example expressions follows these two examples.
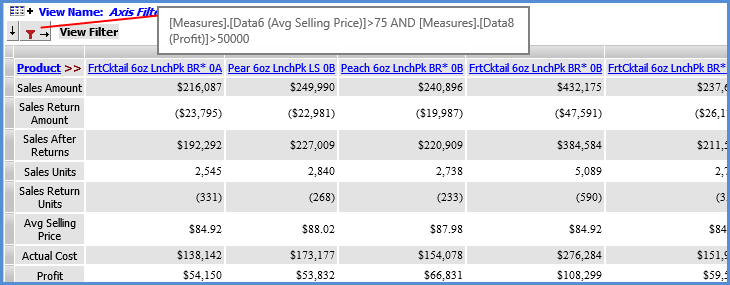
This axis filter on columns returns columns where Avg Selling Price is greater than or equal to $75.00 and Profit is greater than $50,000.
[Measures].[Data6 (Avg Selling Price)]>=75 AND [Measures].[Data8 (Profit)]>50000
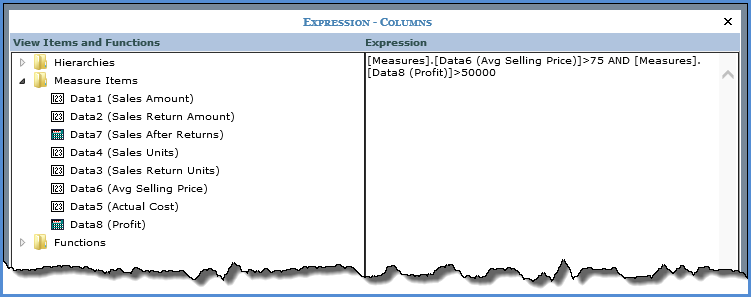
Here is the Expression window for the filter.
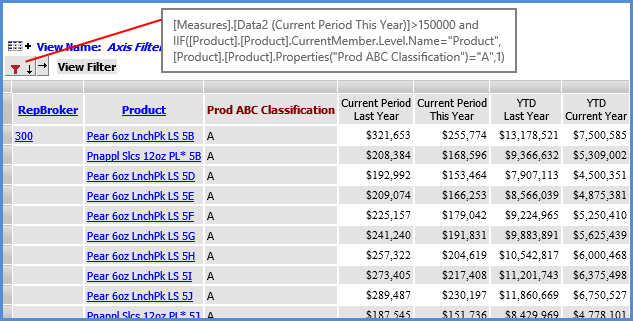
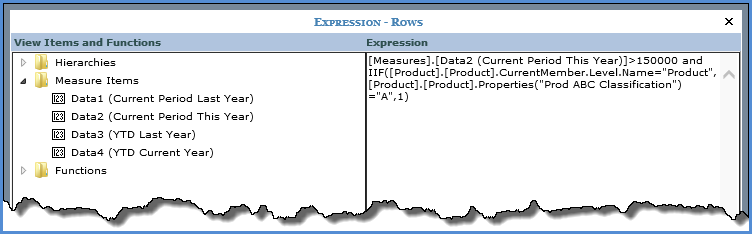
This axis filter on rows returns rows where the Product sales for the current period of the current year are greater than $150,000 and the Prod ABC Classification for the Product is A. The first part of the expression contains the sales measure item criteria, and the second part contains the attribute relationship criteria.
The IIF statement in the second part checks that the level for the attribute relationship referenced in the expression is visible in rows. In this case, the level is visible so Stratum.Viewer considers that filter condition when executing the filter. If the level had not been visible, the condition would have been ignored while executing the filter.
[Measures].[Data2 (Current Period This Year)]>150000 and IIF([Product].[Product].CurrentMember.Level.Name="Product",[Product].[Product].Properties("Prod ABC Classification")="A",1)
Note: The portion of the above MDX that checks for the level visibility references the name of the dimension and hierarchy for the level -- in this case [Product].[Product]. The hierarchy name is needed in cases where there are multiple hierarchies within the same dimension.
This is the Expression window for the filter.
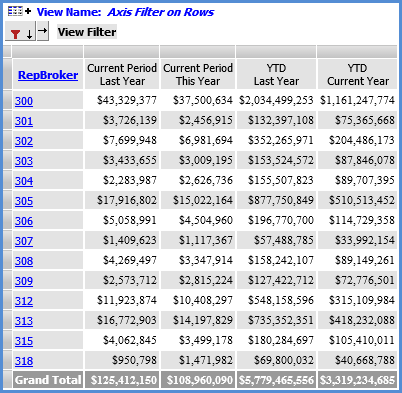
Here's what the view would look like if you were to drill up to RepBroker. Only the [Measures].[Data2 (Current Period This Year)]>150000 part of the axis filter expression is executed since Product is no longer visible.
Desired Results... |
Example Axis Filter |
For all levels, Average Selling Price is >= 75 and Profit > 50,000. |
[Measures].[Data6 (Avg Selling Price)]>=75 And [Measures].[Data8 (Profit)]>50000
|
When at Product level, will return rows where Prod ABC Classification = “A” AND Actual Sales Sales Units Jan 2014 to Sep 2014 is > 150,000. When at any other level - Actual Sales Sales Units Jan 2014 to Sep 2014 is > 150,000. |
[Measures].[Data1 (Actual Sales Sales Units Jan 2014 to Sep 2014)]>150000 and IIF([Product].[Product].CurrentMember.Level.Name="Product",[Product].[Product].Properties("Prod ABC Classification")="A",1) |
Only for the Product level, return rows where Prod ABC Classification = “A” AND Actual Sales Sales Units Jan 2014 to Sep 2014 is > 150,000. When at any other level – No filter applied. |
IIF([Product].[Product].CurrentMember.Level.Name="Product" , IIF ([Product].[Product].Properties("Prod ABC Classification")="A" AND [Measures].[Data1 (Actual Sales Sales Units Jan 2014 to Sep 2014)]>150000, 1,0) , 1) |
When at Product level, will return rows where Actual Sales Sales Units Jan 2014 to Sep 2014 is > 150,000. When at any other level - Actual Sales Sales Units Jan 2014 to Sep 2014 is > 10,000,000. |
IIF([Product].[Product].CurrentMember.Level.Name="Product" , IIF ([Measures].[Data1 (Actual Sales Sales Units Jan 2014 to Sep 2014)]>150000, 1,0) , [Measures].[Data1 (Actual Sales Sales Units Jan 2014 to Sep 2014)] > 10000000) |
When at Product level, will return rows where Prod ABC Classification = “A” AND Actual Sales Sales Units Jan 2014 to Sep 2014 is > 150,000. When at any other level - Actual Sales Sales Units Jan 2014 to Sep 2014 is > 10,000,000. |
IIF([Product].[Product].CurrentMember.Level.Name="Product" , IIF ([Product].[Product].Properties("Prod ABC Classification")="A" AND [Measures].[Data1 (Actual Sales Sales Units Jan 2014 to Sep 2014)]>150000, 1,0) , [Measures].[Data1 (Actual Sales Sales Units Jan 2014 to Sep 2014)] > 10000000) |
These tables have examples that can be used as models when you are setting up calculated measure items.
Note: If you want to set up views that return YTD data, comparisons of current vs past periods, rolling N periods, previous N periods, etc., do so using regular measure items with time ranges. Examples are in Time Ranges vs. Time Hierarchies for YTD, Trending, and Other Time Analysis. If you want to set up a calculated measure item that displays an image, see Display Images for Measure Items.
Type of Calculation & Function |
Example |
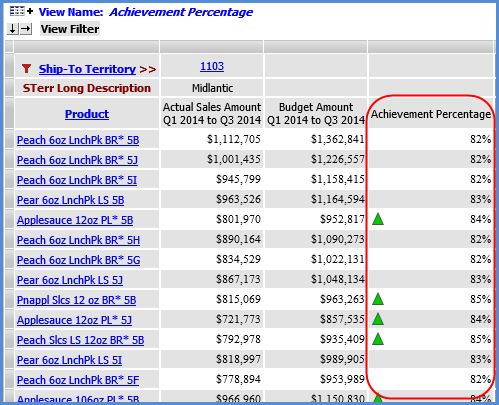
Achievement Percent Has a built-in divide by zero check to avoid divide by zero errors. |
#AchievementPercent([Measures].[Data1 (Actual Sales Sales Amount Q1 2014 to Q3 2014 )], [Measures].[Data2 (Budget Budget Amount Frozen Q1 2014 to Q3 2014)])
|
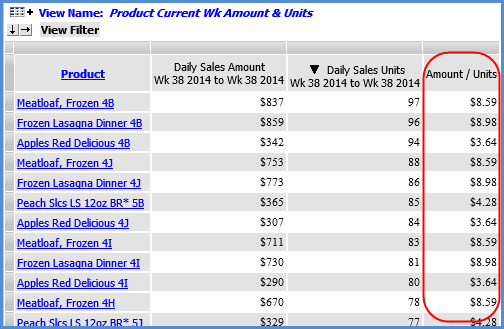
Divide with Zero Check Has a built-in divide by zero check to avoid divide by zero errors. |
#DivideWithZeroCheck([Measures].[Data1 (Daily Sales Amount Wk 38 2014 to Wk 38 2014)], [Measures].[Data2 (Daily Sales Units Wk 38 2014 to Wk 38 2014)])
|
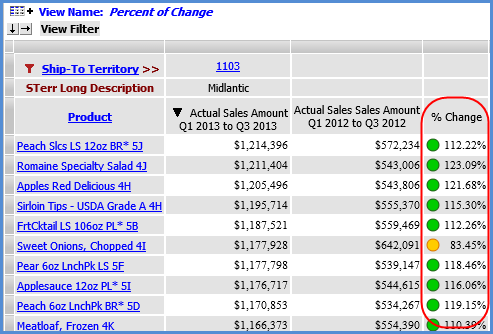
Percent of Change Has a built-in divide by zero check to avoid divide by zero errors. |
#PercentOfChange([Measures].[Data1 (Actual Sales Amount Q1 2013 to Q3 2013)], [Measures].[Data2 (Actual Sales Sales Amount Q1 2012 to Q3 2012)])
|
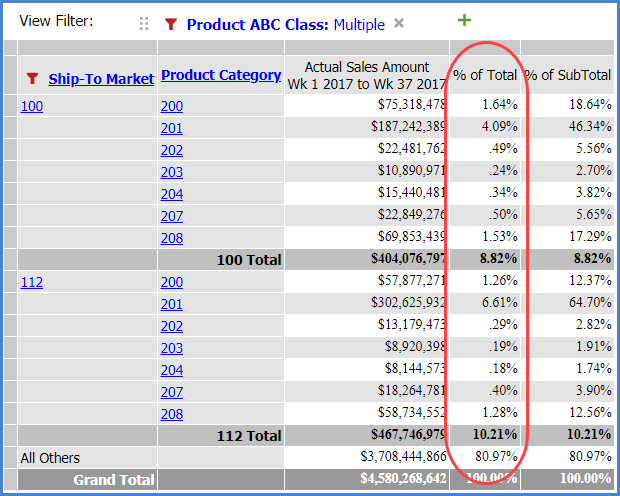
Percent Of Total |
#PercentOfTotal([Measures].[Data1 (Actual Sales Amount Wk 1 2017 to Wk 37 2017)])
|
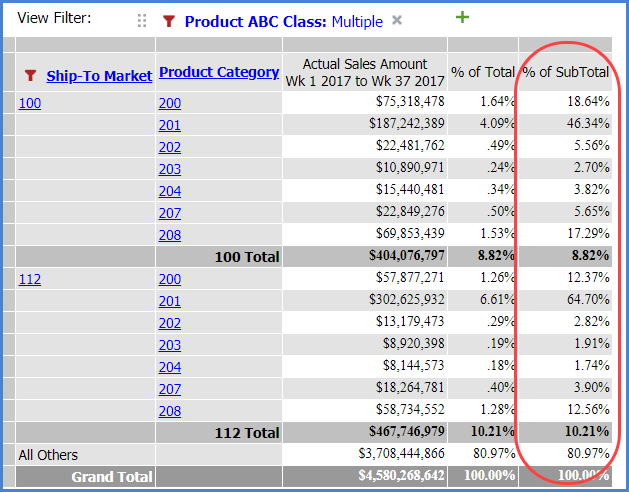
Percent Of Subtotal |
#PercentOfSubtotal([Measures].[Data1 (Actual Sales Amount Wk 1 2017 to Wk 37 2017)])
|
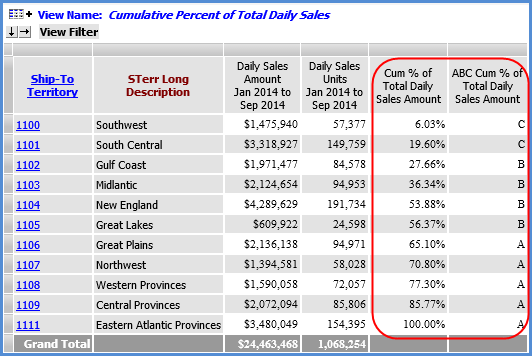
Cumulative Percent Of Total and ABC Cumulative Percent Of Total |
#CumulativePercentOfTotal([Measures].[Data1 (Daily Sales Amount Jan 2014 to Sep 2014)])
and #ABCCumulativePercent([Measures].[Data1 (Daily Sales Amount Jan 2014 to Sep 2014)],".65;.25")
|
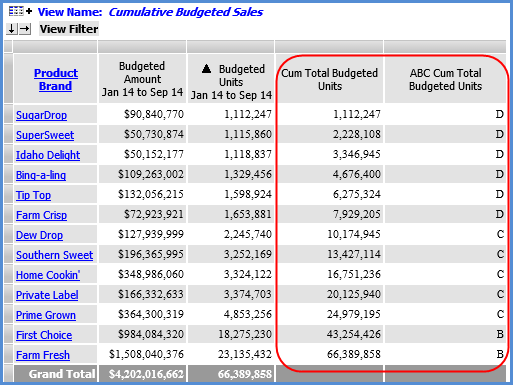
Cumulative Total and ABC Cumulative Total |
#CumulativeTotal([Measures].[Data2 (Budgeted Units Jan 14 to Sep 14)])
and #ABCCumulative([Measures].[Data2 (Budgeted Units Jan 14 to Sep 14)],"75000000.00;35000000.00;10000000.00")
|
The next set of examples show other commonly used calculations including ones that use attributes relationships (also known as attributes) in their expression. Use these expressions to do things like return a text value or numeric value, to segment out some data from a larger pool of data, or to use the value of an attribute relationship in a calculation.
Calculations that use attributes should have validations built into them to ensure they are only performed when certain conditions are met. Validations check for things like whether the levels for the attributes are visible in the view. If conditions are not met, the calculation can instruct Stratum.Viewer to return a null value rather than perform the calculation. Here are examples of validations you should build into expressions that use attributes.
Only perform the calculation if the level of the attribute is displayed in the grid. Include an IIF statement in the expression that checks for the proper level. Calculation is performed if the level is in the grid. A null value is returned if the level is not in the grid.
Only perform the calculation for members (key values) that have measure data. Include an IIF statement in the expression that checks whether data exists for the applicable measure item. Calculation is performed for key values that have data. A null value is returned for key values without data. If your calculation does not have this validation built into it, all key values will be included in view results.
Verify attribute data is the correct type need by the calculation. For example, include an IIF statement that tells Viewer to only perform the calculation if the attribute data is numeric. If it is not, the statement tells Viewer to return a null value for the results.
Type of Calculation & Function |
Example Expression |
Average Uses Average numeric function. |
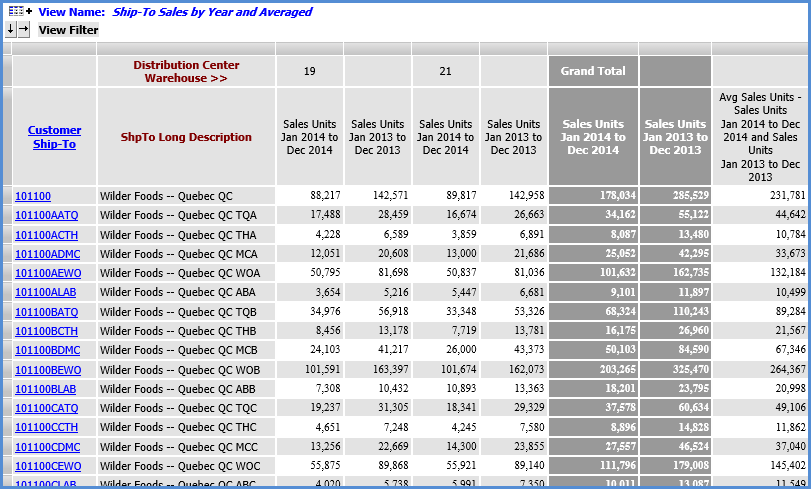
Avg({[Measures].[Data1 (Sales Units Jan 2014 to Dec 2014)], [Measures].[Data2 (Sales Units Jan 2013 to Dec 2013)]}) · Returns average sales units for 2013 and 2014. The expression syntax includes the names (Data1 and Data2) and captions of two regular measure items that are part of the view. · Recommendation: Set the Type property to Distinct Calculated.
|
Difference |
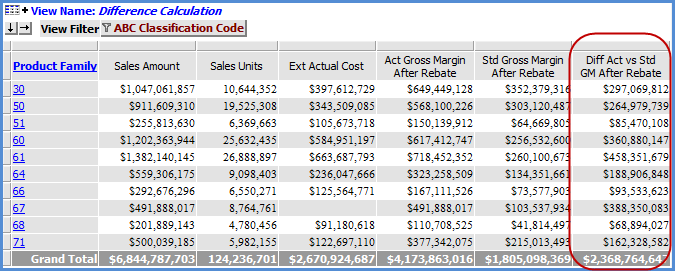
[Measures].[Data22 (Act Gross Margin After Rebate)]-[Measures].[Data21 (Std Gross Margin After Rebate)] Returns difference between the Act Gross Margin After Rebate and Std Gross Margin After Rebate measure items (their captions and the measure item names Data22 and Data21 are part of the MDX syntax in the expression).
|
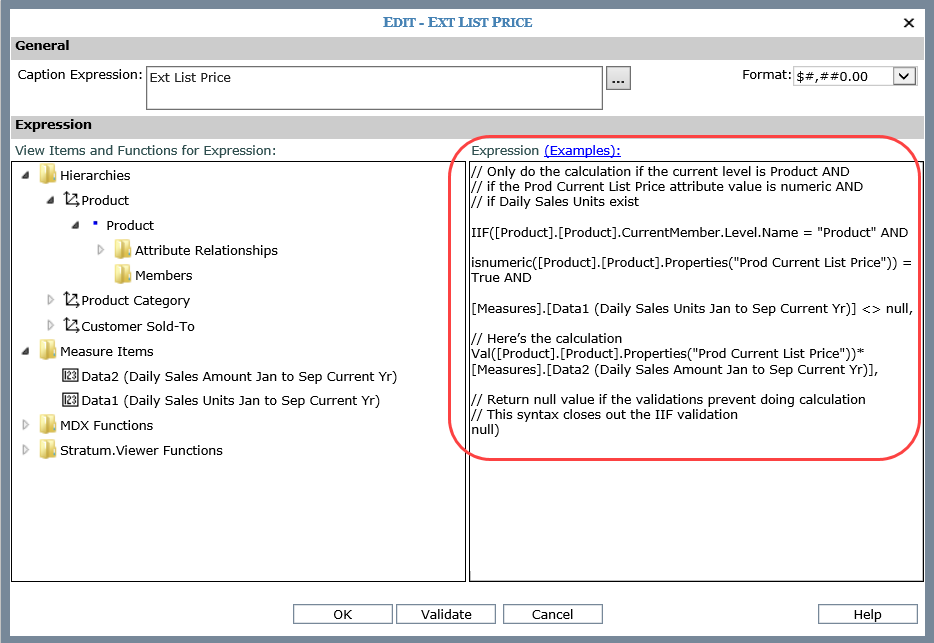
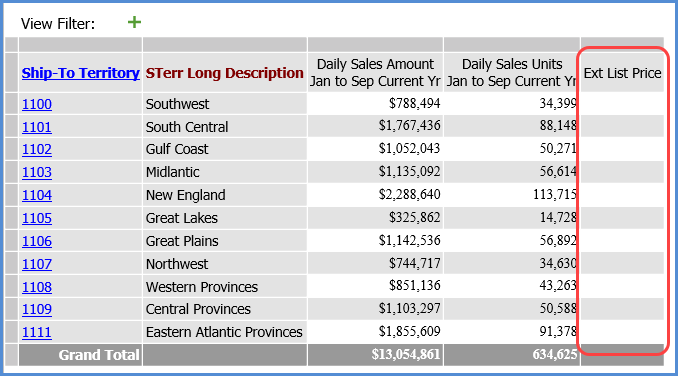
Extended List Price Uses attribute relationship and Val function. |
This calculation determines the extended list price for the year to date by multiplying a measure item in a view by the Prod Current List Price attribute relationship from the Product level. It uses a Val function in its expression. Validations built into the calculation only allow it to proceed if the attribute relationship in it has numeric values and other specified items are active in the view at the time the calculation is performed. If any condition specified by a validation is not met, a null value is returned instead of performing the calculation. The full expression follows. The text in green, bold font is the core calculation. Text preceded by a // mark are comments that explain each part of the expression. Comments are ignored by Viewer. A monetary format is recommended for this type of calculation. Full Expression:// Only do the calculation if the current level is Product AND // if the Prod Current List Price attribute value is numeric AND // if Daily Sales Units exist IIF([Product].[Product].CurrentMember.Level.Name = "Product" AND isnumeric([Product].[Product].Properties("Prod Current List Price")) = True AND [Measures].[Data1 (Daily Sales Units)] <> null, // Here’s the calculation Val([Product].[Product].Properties("Prod Current List Price"))*[Measures].[Data2 (Daily Sales Units)], // Return null value if the validations prevent doing calculation // This syntax closes out the IIF validation null) The following image shows what the expression looks like in Viewer’s Expression window.
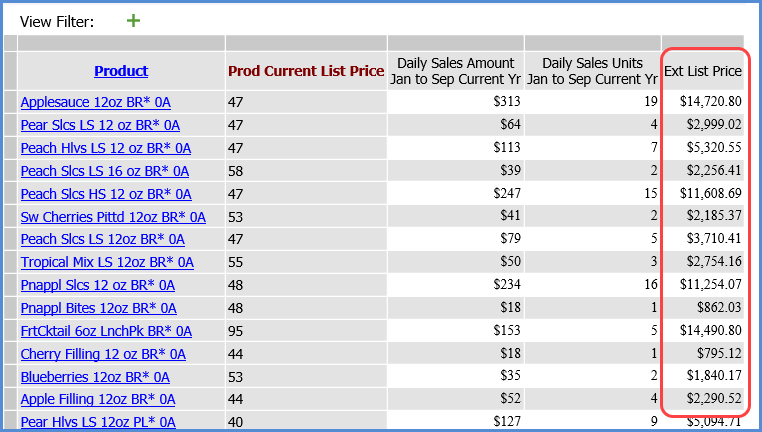
Here is the view when the Product level is visible. The calculation is performed.
Here is the view after some changes were made to the levels for it. Product level is no longer visible, so the calculation is not performed. Null values are returned.
|
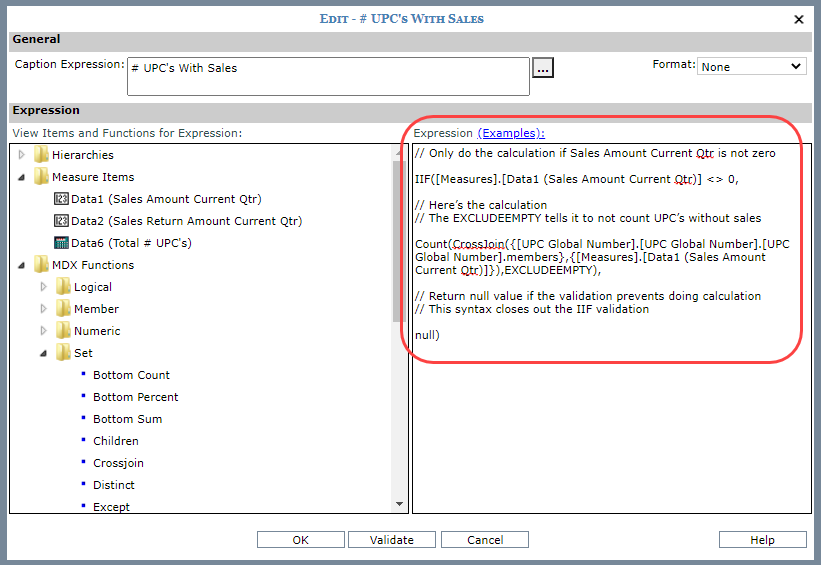
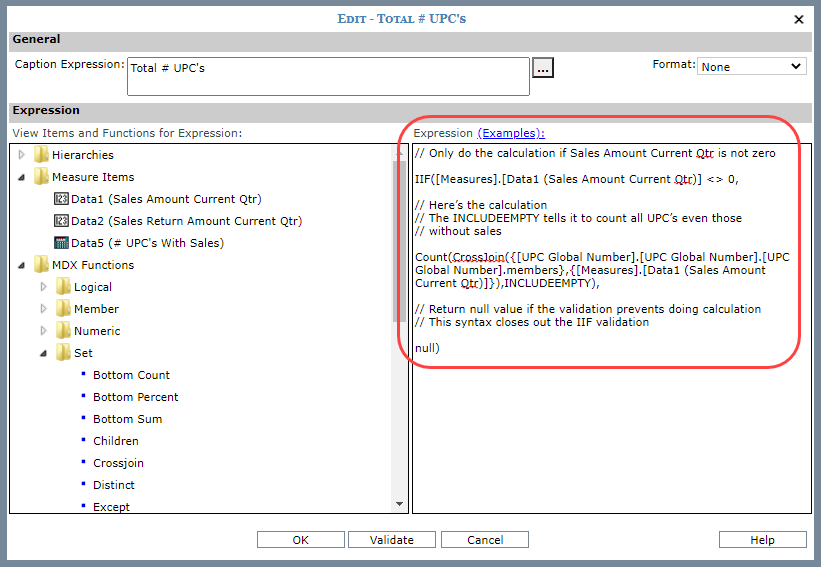
Number of UPC’s Sold and Total Number of UPC’s Uses Count numeric function and CrossJoin function. |
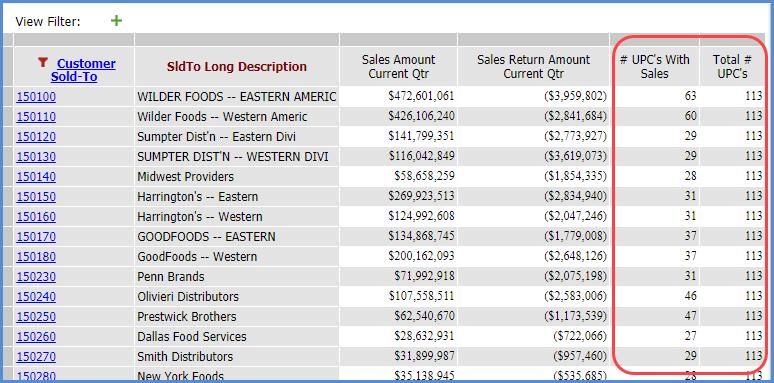
The first calculation counts the number of UPC’s that have sales for the level visible in the view. The second calculation counts the total number of UPC’s. The UPC level is evaluated against sales amount values for the current quarter. Validations built into each calculation only allow it to proceed if it meets certain conditions. If the condition specified by a validation is not met, a null value is returned instead of performing the calculation. Each full expression follows. The text in green, bold font is the core calculation. Text preceded by a // mark are comments that explain each part of the expression. Comments are ignored by Viewer. For both calculations, Format and the Total properties are set to None. Full Expression For Counting Only UPC’s With Sales:// Only do the calculation for values where Sales Amount Current Qtr is not zero IIF([Measures].[Data1 (Sales Amount Current Qtr)] <> 0, // Here’s the calculation // The EXCLUDEEMPTY tells it to not count UPC’s without sales Count(CrossJoin({[UPC Global Number].[UPC Global Number].[UPC Global Number].members},{[Measures].[Data1 (Sales Amount Current Qtr)]}),EXCLUDEEMPTY), // Return null value if the validation prevents doing calculation // This syntax closes out the IIF validation null) Full Expression For Counting UPC’s With and Without Sales:// Only do the calculation for values where Sales Amount Current Qtr is not zero IIF([Measures].[Data1 (Sales Amount Current Qtr)] <> 0, // Here’s the calculation // The INCLUDEEMPTY tells it to count all UPC’s even those // without sales Count(CrossJoin({[UPC Global Number].[UPC Global Number].[UPC Global Number].members},{[Measures].[Data1 (Sales Amount Current Qtr)]}),INCLUDEEMPTY), // Return null value if the validation prevents doing calculation // This syntax closes out the IIF validation null) The following images shows what each expression looks like in Viewer’s Expression window. The last image shows the results in the view with the calculation results displayed in the marked columns.
Here is the view showing calculation results.
|
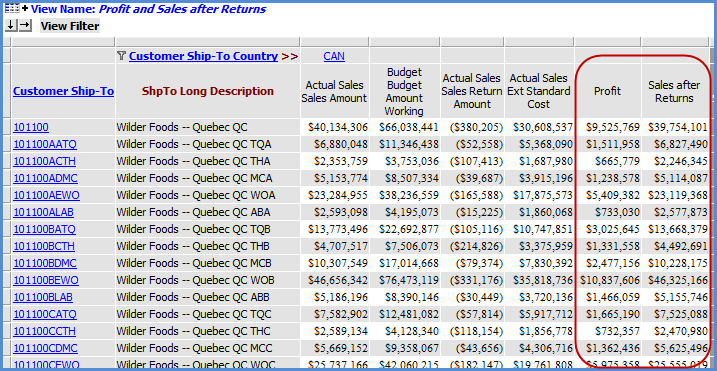
Profit (Sales after Costs) and Sales after Returns Uses Absolute value of a measure item. |
[Measures].[Data2 (Actual Sales Sales Amount)]-[Measures].[Data1 (Actual Sales Ext Standard Cost)] and [Measures].[Data2 (Actual Sales Sales Amount)]-abs([Measures].[Data4 (Actual Sales Sales Return Amount)])
|
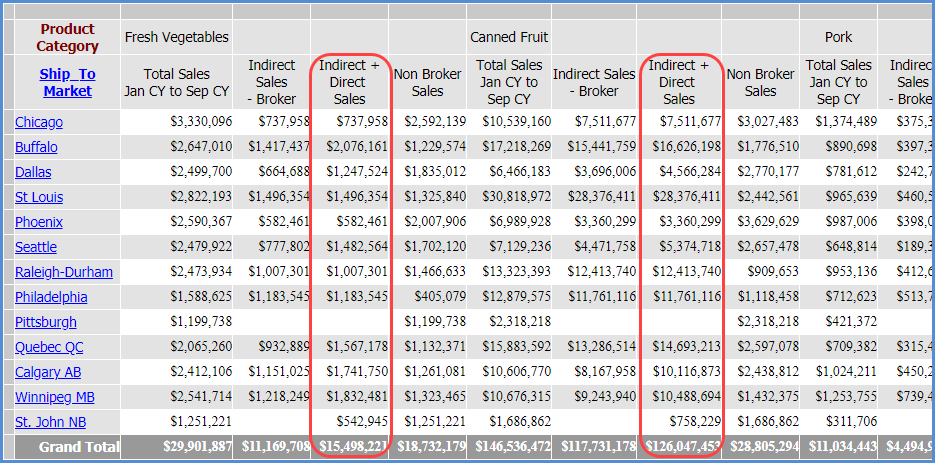
Segment the Total Sales For a Level by Specific Members of a Different Level (see more detail)
Uses the SUM function, Members, and Tuples |
This type of calculation lets you segment totals for levels in your view by members of other levels. For example, look at a Ship-To Market and Product Category sales by specific distribution channels. The following gives you the total sales within each Market/Category for only two specific distribution channels and ignores values for all other channels. IIF([Measures].[Data1 (Total Sales Jan CY to Sep CY)]<>0,SUM({[Distribution Channel].[Distribution Channel].[Distribution Channel].[INB],[Distribution Channel].[Distribution Channel].[Distribution Channel].[DIR]},[Measures].[Data1 (Total Sales Jan CY to Sep CY)]),null)
|
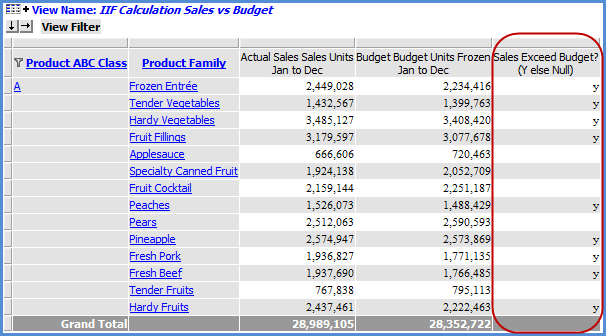
Return Text Value if Condition is Met Uses IIF function to check for conditions and determine which results to return. |
IIF([Measures].[Data22 (Actual Sales Sales Units Jan to Dec)]>[Measures].[Data2 (Budget Budget Units Frozen Jan to Dec)],"y",null)
|
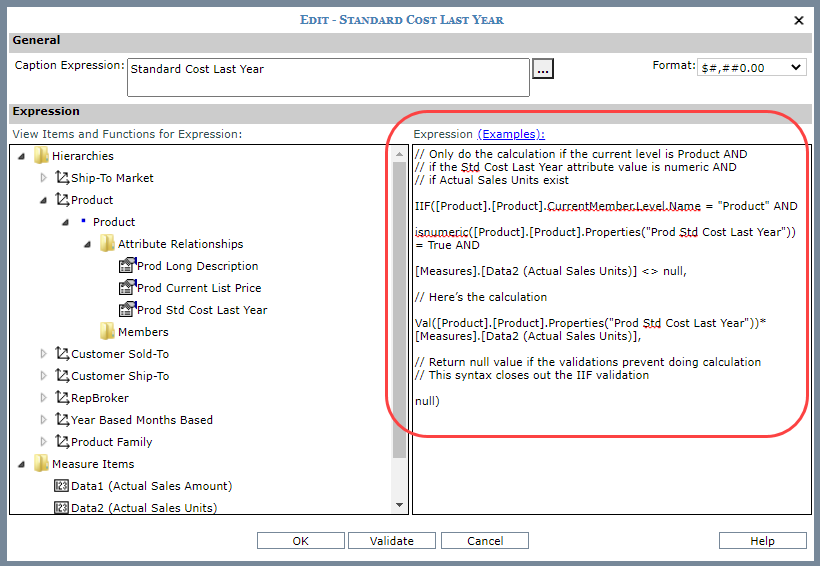
Standard Cost Uses Val function and attribute relationship. |
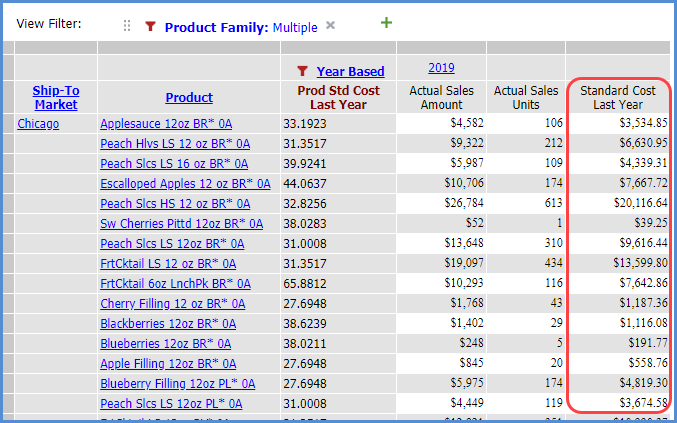
This calculation determines the standard cost for last year by multiplying a measure item in a view by the value of a Std Cost Last Year attribute relationship from the Product level. It uses a Val function in its expression. Validations built into the calculation only allow it to proceed if the attribute relationship in it has numeric values and other specified items are active in the view at the time the calculation is performed. If any condition specified by a validation is not met, a null value is returned instead of performing the calculation. The full expression follows. The text in green, bold font is the core calculation. Text preceded by a // mark are comments that explain each part of the expression. Comments are ignored by Viewer. The Format property for the calculation is set to a monetary format and its Total property is set to None. Full Expression:// Only do the calculation if the current level is Product AND // if the Std Cost Last Year attribute value is numeric AND // if Actual Sales Units exist IIF([Product].[Product].CurrentMember.Level.Name = "Product" AND isnumeric([Product].[Product].Properties("Prod Std Cost Last Year")) = True AND [Measures].[Data2 (Actual Sales Units)] <> null, // Here’s the calculation Val([Product].[Product].Properties("Prod Std Cost Last Year"))*[Measures].[Data2 (Actual Sales Units)], // Return null value if the validations prevent doing calculation // This syntax closes out the IIF validation null) The following image shows what the expression looks like in Viewer’s Expression window.
The next image shows the view when the Product level is visible. The calculation is performed because all calculation conditions were met including the condition that Product must be visible.
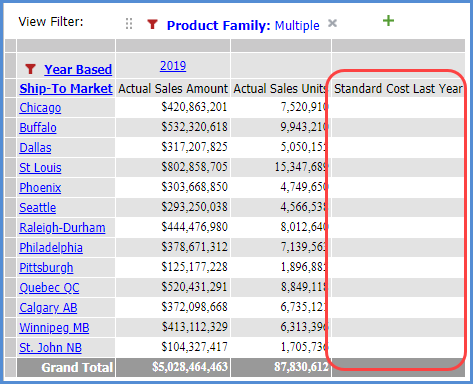
Here is the view when Ship-to Market has been drilled up to and Product is no longer visible. Viewer returns null values instead of performing the calculation because Product is not visible.
|
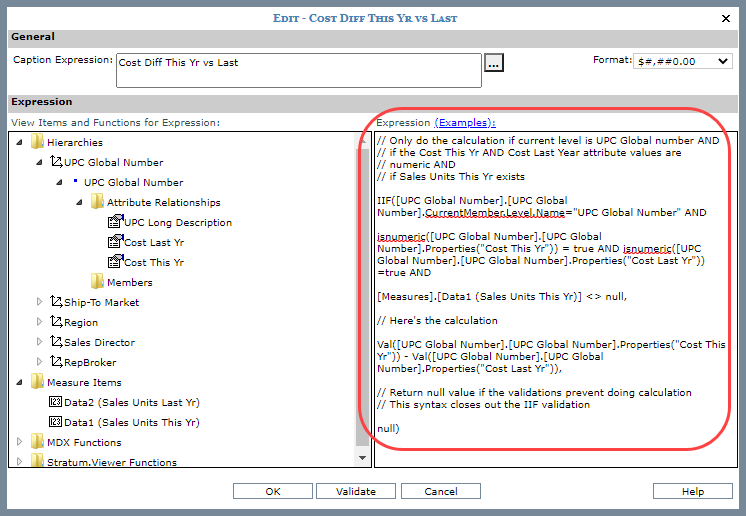
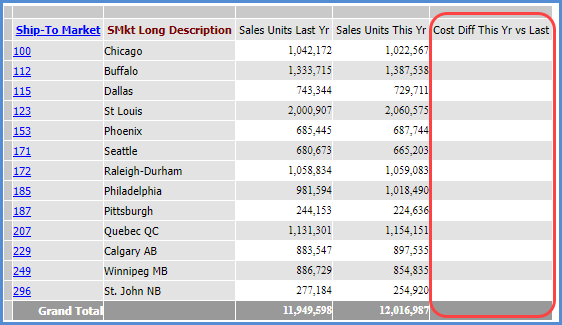
Cost Difference Calculation uses values from a level’s attribute relationship (attributes). |
This example uses a Val function and two Cost attribute relationships for UPC Global Number. The “Cost This Yr” and “Cost Last Yr” attributes are subtracted to find the difference in costs between this year and last year. Validations built into the calculation only allow it to proceed if the attribute relationships in it are numeric values and other specified items are active in the view at the time the calculation is performed. If any condition specified by a validation is not met, a null value is returned instead of performing the calculation. The full expression follows. The text in green, bold font is the core calculation. Text preceded by a // mark are comments that explain each part of the expression. Comments are ignored by Viewer. The Format property for the calculation is set to a numeric format and its Total property is set to None. Full Expression:// Only do the calculation if current level is UPC Global number AND // if the Cost This Yr AND Cost Last Year attribute values are // numeric AND // if Sales Units This Yr exists IIF([UPC Global Number].[UPC Global Number].CurrentMember.Level.Name="UPC Global Number" AND isnumeric([UPC Global Number].[UPC Global Number].Properties("Cost This Yr")) = true AND isnumeric([UPC Global Number].[UPC Global Number].Properties("Cost Last Yr")) =true AND [Measures].[Data1 (Sales Units This Yr)] <> null, // Here's the calculation Val([UPC Global Number].[UPC Global Number].Properties("Cost This Yr")) - Val([UPC Global Number].[UPC Global Number].Properties("Cost Last Yr")), // Return null value if the validations prevent doing calculation // This syntax closes out the IIF validation null) The following image shows what the expression looks like in Viewer’s Expression window.
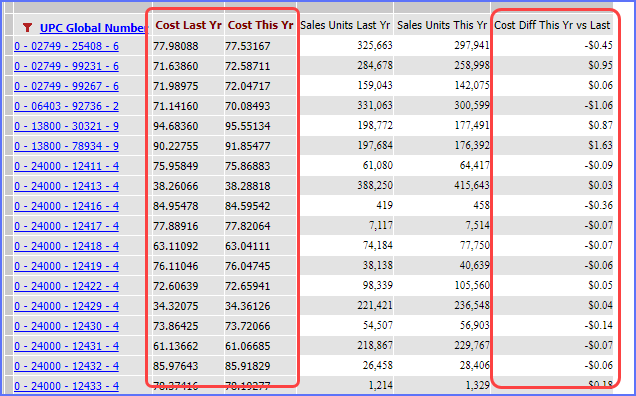
The next image shows results in the view when all calculation conditions were met and Viewer performed the calculation. The calculation results are in the last column.
This final image shows results in the view when one of the calculations conditions was not met. The UPC Global Number level is not visible in the view, so Viewer returned a null value instead of performing the calculation.
|
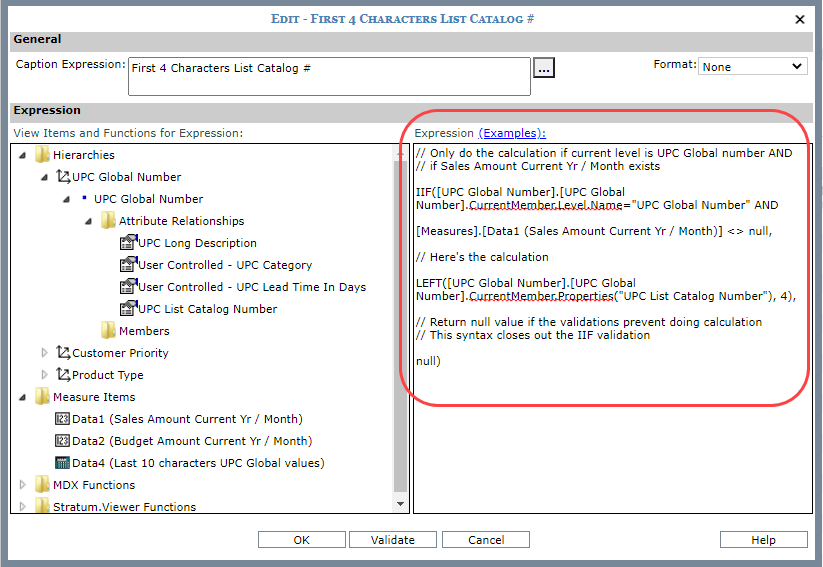
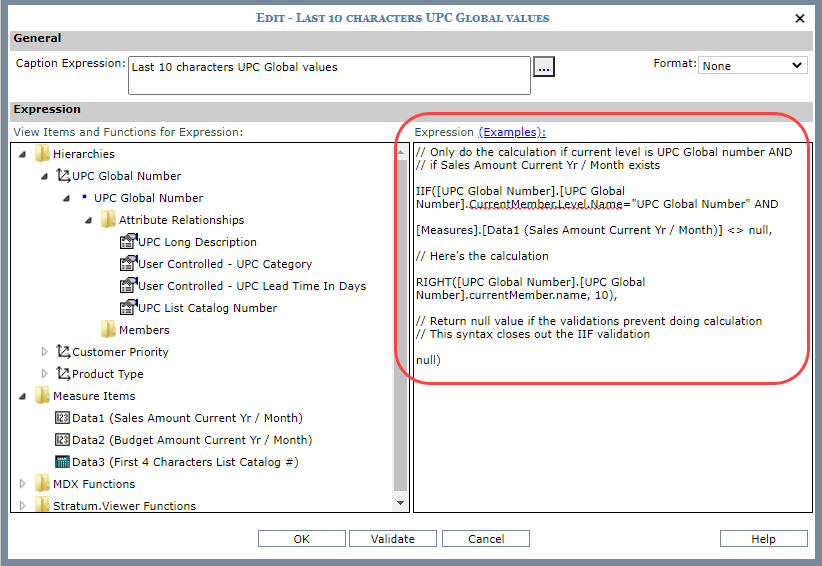
Truncate String Of Characters From Level Or Attribute Values The LEFT and RIGHT functions are used in these calculations. |
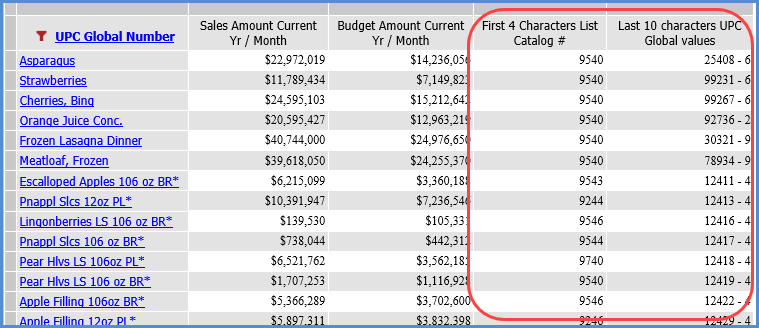
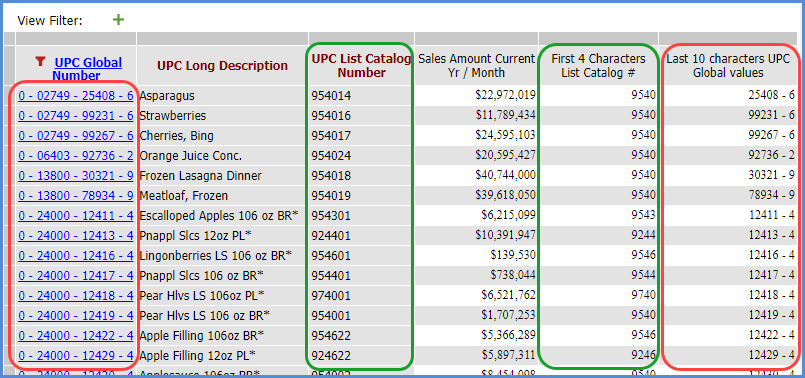
The following calculations return a string of ‘x’ number of characters from the values of other items in a view. The first calculation returns the first 4 characters of the UPC List Catalog Number attribute relationship from the UPC Global Number level. The second calculation returns the last 10 characters of the key values for that level. Validations built into the calculation only allow it to proceed if the level is visible in the view. If that validation is not met, a null value is returned instead of performing the calculation. The full expression follows. The text in green, bold font is the core calculation. Text preceded by a // mark are comments that explain each part of the expression. Comments are ignored by Viewer. Both calculations have their Format and Total properties set to None. Full Expression Returning First 4 Characters For Attribute Values:// Only do the calculation if current level is UPC Global number AND // if Sales Amount Current Yr / Month exists IIF([UPC Global Number].[UPC Global Number].CurrentMember.Level.Name="UPC Global Number" AND [Measures].[Data1 (Sales Amount Current Yr / Month)] <> null, // Here's the calculation LEFT([UPC Global Number].[UPC Global Number].CurrentMember.Properties("UPC List Catalog Number"), 4), // Return null value if the validations prevent doing calculation // This syntax closes out the IIF validation null) Full Expression Returning Last 10 Characters For Level Values:// Only do the calculation if current level is UPC Global number AND // if Sales Amount Current Yr / Month exists IIF([UPC Global Number].[UPC Global Number].CurrentMember.Level.Name="UPC Global Number" AND [Measures].[Data1 (Sales Amount Current Yr / Month)] <> null, // Here's the calculation RIGHT([UPC Global Number].[UPC Global Number].currentMember.name, 10), // Return null value if the validations prevent doing calculation // This syntax closes out the IIF validation null) The following images shows what each expression looks like in Viewer’s Expression window. The last image shows the results in the view when the UPC Global Number level is visible in the view, which meets the calculation conditions and allows Viewer to move ahead with performing the calculation.
Results of the calculations are shown in the last two columns.
This variation on the view displays the truncated items (the level value and one of its attributes) to show you the difference between their original states versus their truncated states returned by the calculations.
|
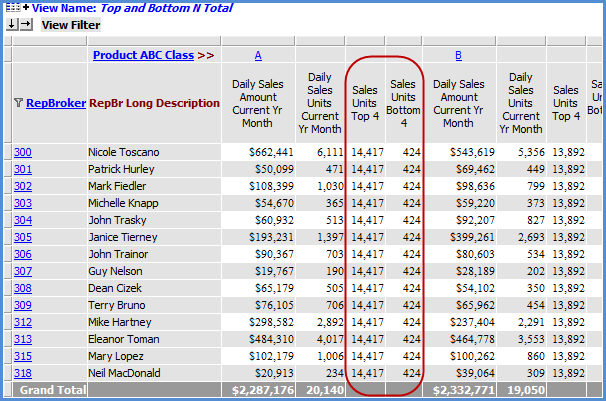
Top N Total and Bottom N Total Use Sum function. |
Sum({TopCount([RepBroker].[RepBroker].[RepBroker].members, 4, [Measures].[Data2 (Daily Sales Units Current Yr Month)])}, [Measures].[Data2 (Daily Sales Units Current Yr Month)]) and Sum({BottomCount([RepBroker].[RepBroker].[RepBroker].members, 4, [Measures].[Data2 (Daily Sales Units Current Yr Month)])}, [Measures].[Data2 (Daily Sales Units Current Yr Month)])
|
Variance Percentage
|
Use the Percent of Change function when you want to include a variance percentage calculation in your view. That function is a Stratum.Viewer function that automatically includes a divide by zero check in the calculation to avoid divide by zero errors. See the first table in this topic for an example. |
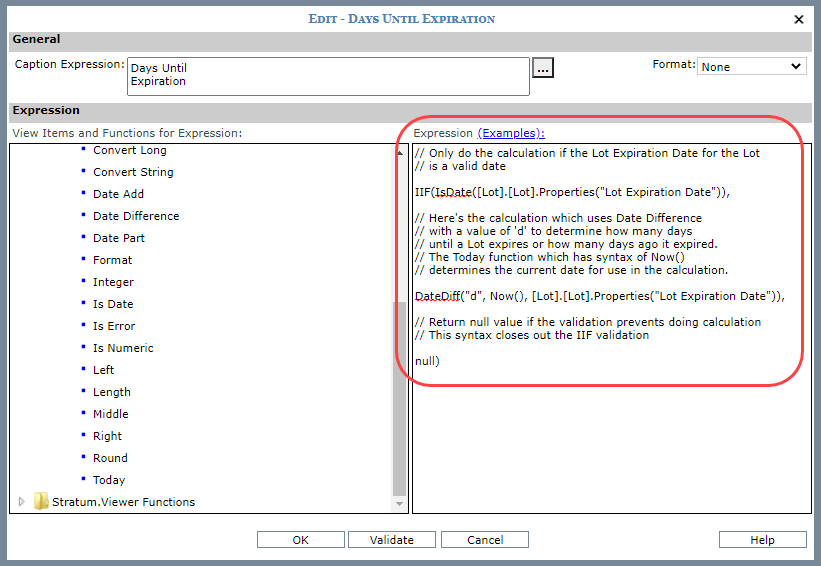
Days Until Expiration Uses the Date Difference function, Today date function, and an attribute relationship. |
This calculation shows us days until Lots expire. It uses the Date Difference function with a value of "d" to calculate the difference in days between the current date and Lot Expiration Date. A Today function provides the current date while one of the Lot level’s attribute relationships provides the expiration date. A validation built into the calculation only allows it to proceed if the Lot has a valid expiration date. If the condition is not met, a null value is returned instead of performing the calculation. The full expression follows. The text in green, bold font is the core calculation. Text preceded by a // mark are comments that explain each part of the expression. Comments are ignored by Viewer. The Format and Total properties for the calculation are set to None. Notes: This example calculates the "days" until expiration using the parameter of "d" in the Date Difference function. These other parameters can be used to calculate results in other intervals of time: yyyy for year, q for quarter, m for month, y for day of year, w for weekday, ww for week, h for hour, m for minute, and s for second. Full Expression:// Only do the calculation if the Lot Expiration Date for the Lot // is a valid date IIF(IsDate([Lot].[Lot].Properties("Lot Expiration Date")), // Here's the calculation which uses Date Difference // with a value of 'd' to determine how many days // until a Lot expires or how many days ago it expired. // The Today function which has syntax of Now() // determines the current date for use in the calculation. DateDiff("d", Now(), [Lot].[Lot].Properties("Lot Expiration Date")), // Return null value if the validation prevents doing calculation // This syntax closes out the IIF validation null) The following image shows what the expression looks like in Viewer’s Expression window.
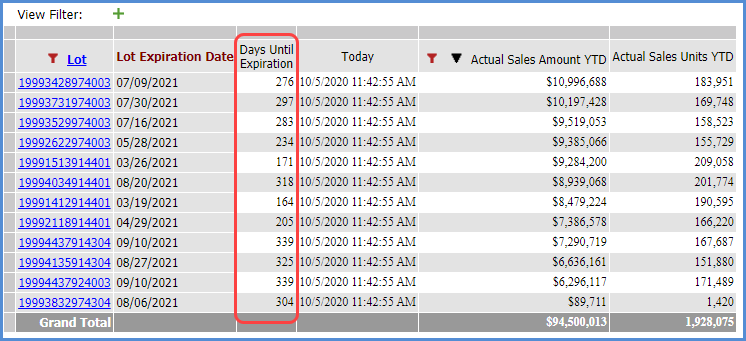
The next image shows results in the view when the calculation condition was met and Viewer performed the calculation. Notes: Results with negative numbers would indicate that a Lot already expired “x” days ago. For example, something that expired 5 days ago would have a -5 result. This example does not have any expired Lots.
|
Examples of measure item captions that use different combinations of variables and static text are shown below. Examples are shown for all types of measure items -- regular with time ranges, regular without time ranges, and calculated. Captions can include a combination of the following elements or just one of these elements, whatever your preference:
Variables that specify the type of data to return such as the name of the underlying measure, the long description of the From and To periods for time ranges, or the name and description of conditional formats applied to the measure items. For captions of calculated measure items, you also can include variables such as the captions of measure items that make up the calculated measure item’s expression. Stratum.Viewer evaluates the variables when you run a view and pulls in the proper data from the most current data in Analysis Services database on which the view was built.
Static text that remains the same each time the view is executed.
Line breaks that place different parts of the caption on separate lines. If you don't use line breaks, only text wrapping will control the caption display. Line wrapping updates automatically as the size of the grid area or browser changes.
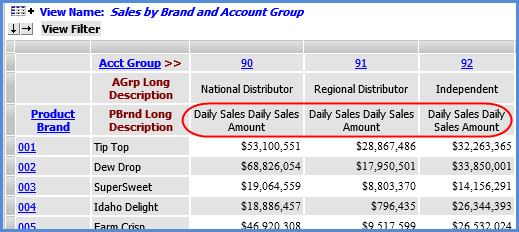
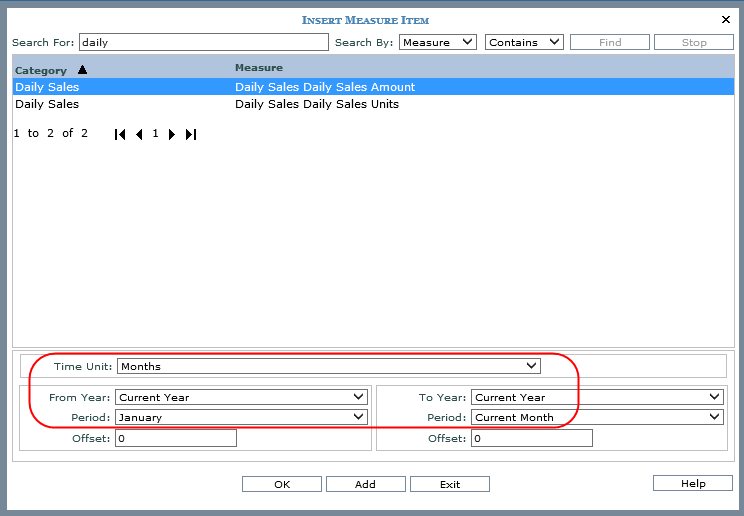
Here are the properties for a measure item with a time range. The measure item is based on the Daily Sales Daily Sales Amount measure from the Daily Sales category.
Here are some examples of caption expressions that were set up for the measure item and what each executed caption looked like in the view. In these examples, the current year is 2014 and the current month is September. The time elements in the evaluated captions reflect that current state of the data. Variables are the parts of the expressions that have brackets [ ] around them.
Builds Caption with... |
Example Expression & Caption |
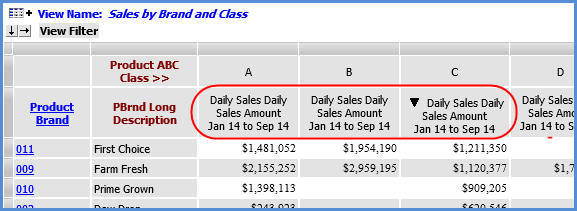
Variables for measure, short description of periods, and short format for year (separated by spaces and static text) |
Expression [Measure] [From Period Short Desc] [From Year YY] to [To Period Short Desc] [To Year YY] Caption in View
|
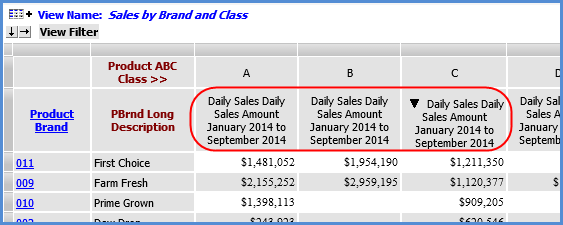
Variables for measure, long description of periods, and long format for years (separated by spaces and static text) |
Expression [Measure] [From Period Long Desc] [From Year YYYY] to [To Period Long Desc] [To Year YYYY] Caption in View
|
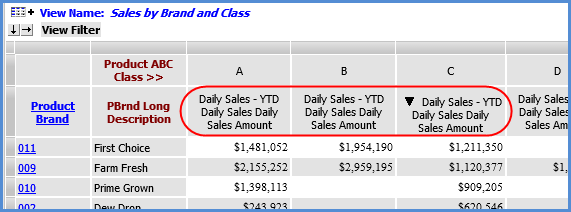
Variable for category and measures (separated by spaces and static text) |
Expression [Category] - YTD [Measure] Caption in View
|
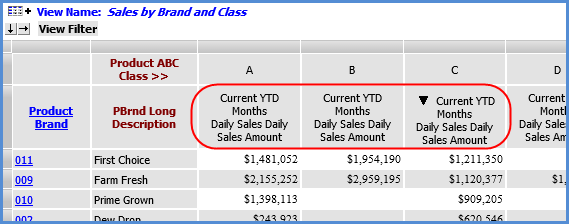
Static text, line breaks, and variable for measure |
Expression Current YTD Caption in View
|
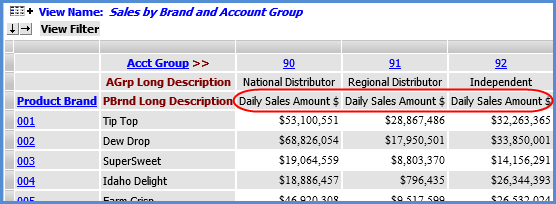
Here are the properties for a measure item without time ranges. This measure item also is based on the Daily Sales Daily Sales Amount measure from the Daily Sales category.
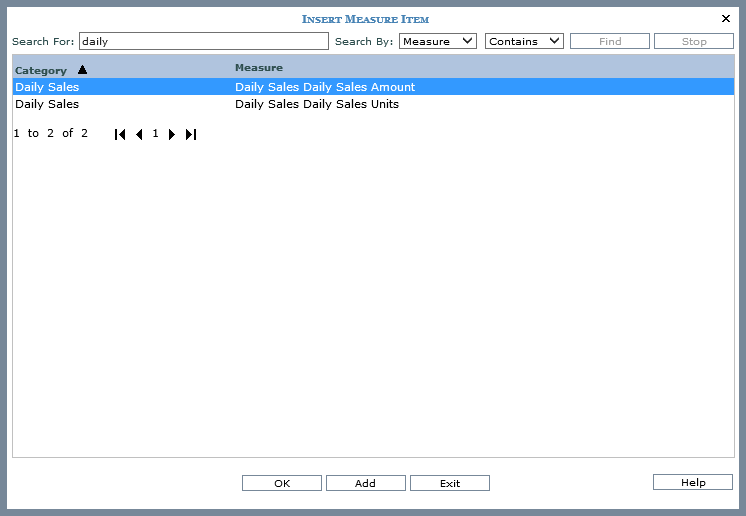
Next are some examples of caption expressions that were set up for the measure item and what each executed caption looked like in the view. Variables are the parts of the expressions that have brackets [ ] around them.
Builds Caption with... |
Example Expression & Caption |
Variable for measure |
Expression [Measure] Caption in View
|
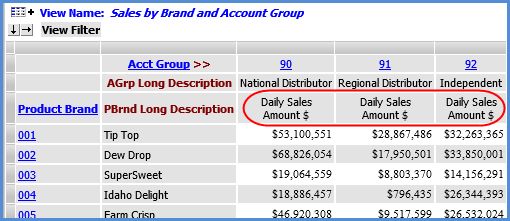
Variable for category and static text |
Expression [Category] Amount $ Caption in View
|
Variable for category, line break, and static text |
Expression [Category] Caption in View
|
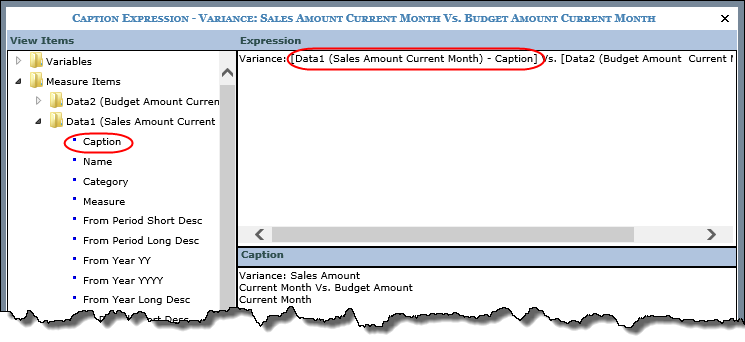
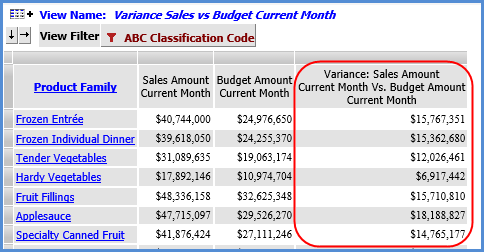
Here is an expression for a calculated measure item that uses two other measure items in a view to perform its calculation. In the examples that follow, caption variables from a sales amount and budget amount measure item in the view will be used to generate the caption for the calculated measure item.
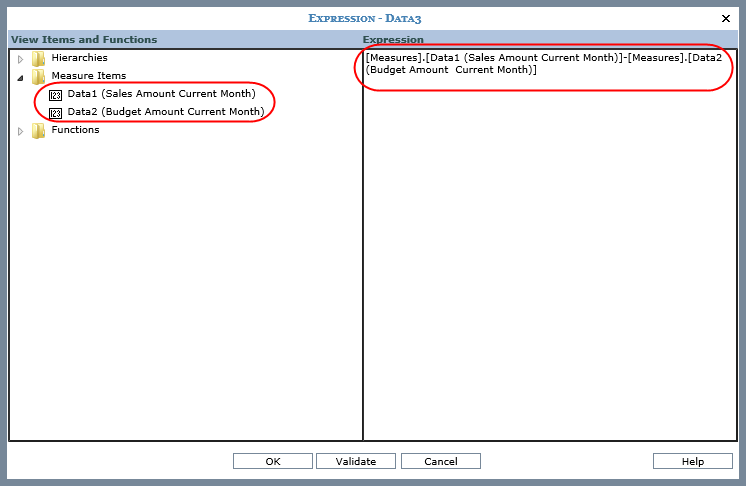
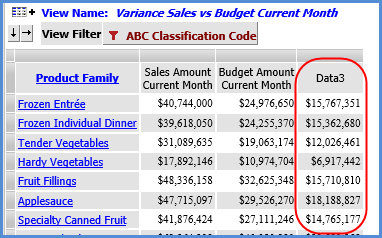
Here is the view before the caption for the calculated measure item is customized. The caption is currently the default, which is the name of the calculated measure item – in this case Data3.
Next are two examples of caption expressions that were set up for the measure item and what each evaluated caption looked like in the view. Both examples that follow include static text and the captions of the sales amount and budget amount measure items that comprise the calculation. The caption for the calculated measure item will reflect the current period details from the sale amount and budget amount measure items. That caption will automatically adjust as the time period and data used in the calculation changes. The first example does not use line breaks in the caption expression. The second example includes line breaks.
Builds Caption with... |
Example Expression & Caption |
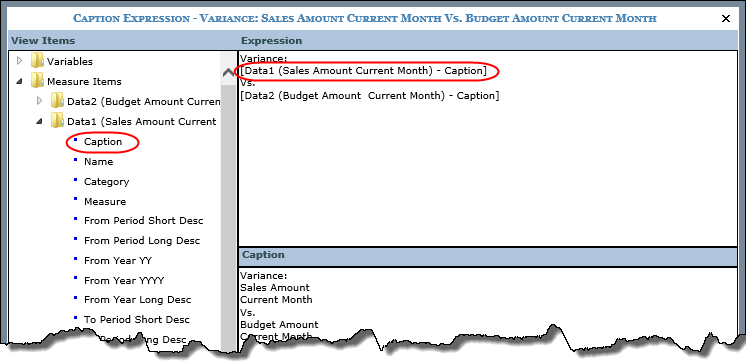
Static text, ‘Caption’ variables from two other measure items, without line break |
Expression
Caption in View
|
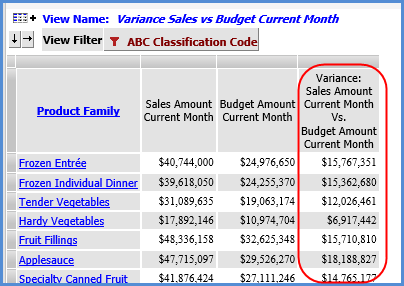
Static text, ‘Caption’ variables from two other measure items, with line breaks |
Expression
Caption in View
|
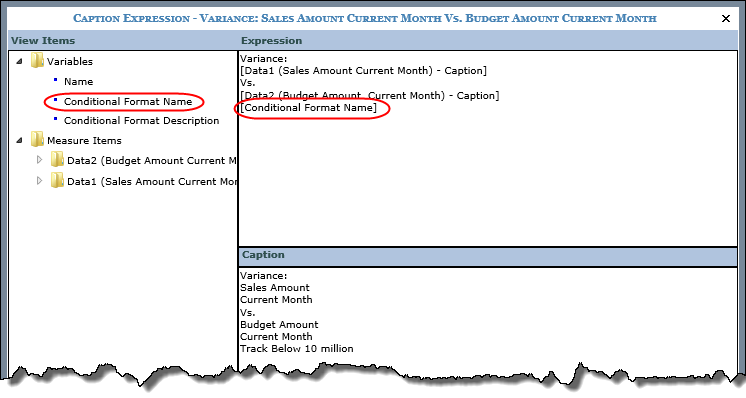
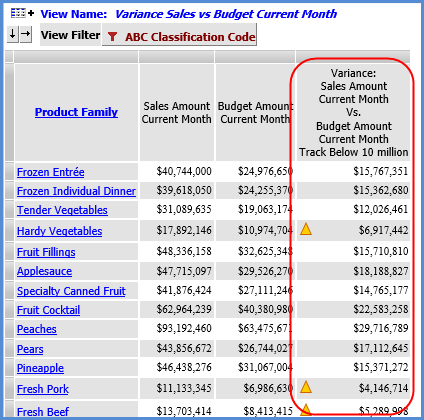
Next is the same calculated measure item with a conditional format applied to it. The conditional format is named Track Below 10 million and it displays a yellow arrow when the variance is below $10,000,000. The next example shows the grid after the caption expression was edited to include the Conditional Format Name variable in the expression.
Builds Caption with... |
Example Expression & Caption |
Variable for conditional format name |
Expression
Caption in View
|
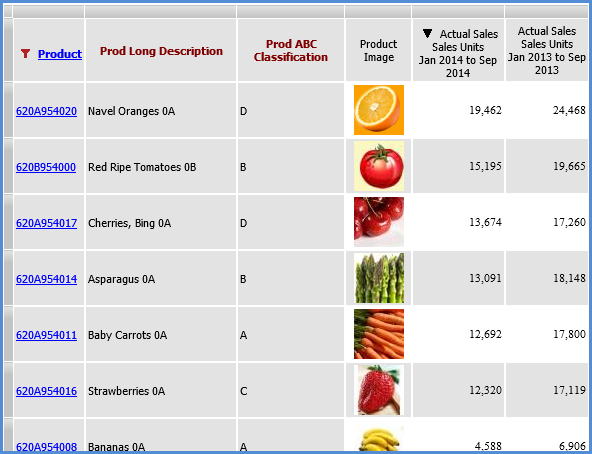
This view displays an image for each product. The calculated measure item “Product Image” defines the location and file name of the product images.
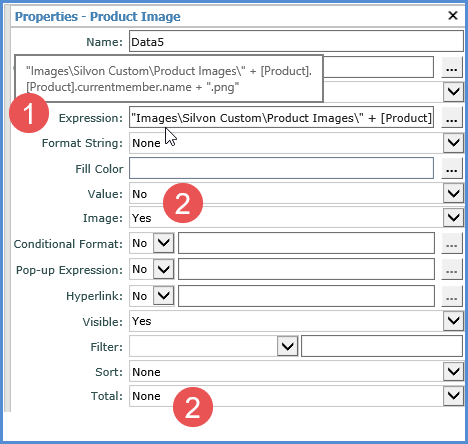
The Product Image measure item is defined as follows:
|
Expression – In this example, the product images reside in a subfolder of the Stratum.Viewer Images folder called “Silvon Custom/Product Images”. The first part of the expression determines the location of the product images and the remainder dynamically determines the file name. "Images\Silvon Custom\Product Images\" + [Product].[Product].currentmember.name + ".png" |
|
Value – Set to No. Image – Set to Yes (required to display the image defined by the expression). Total – Set to None. |
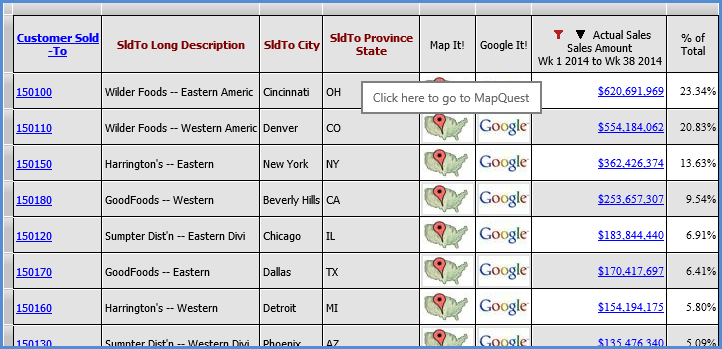
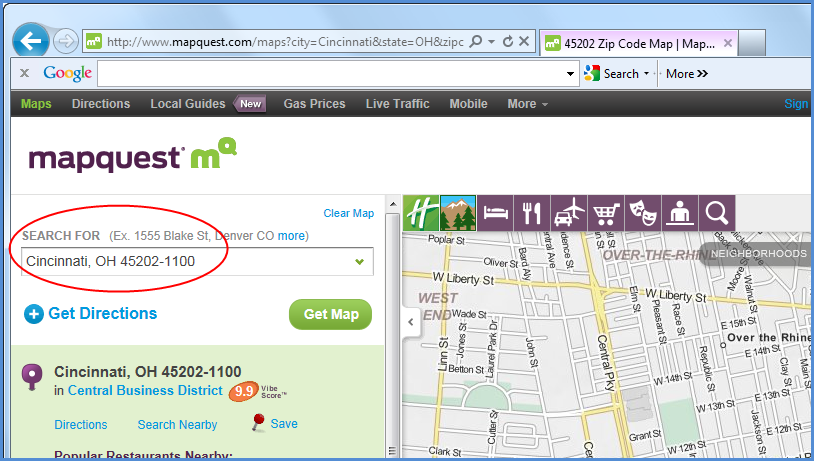
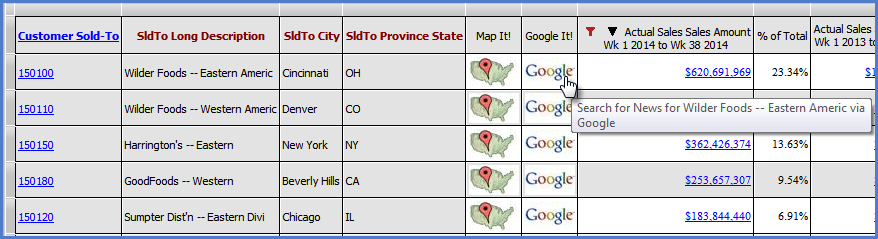
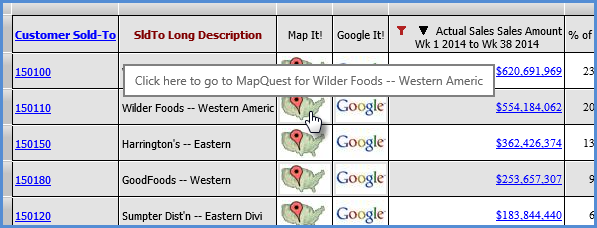
The example that follows shows a view containing images with hyperlinks that will take the user to MapQuest and Google using information from each Customer Sold-To attribute relationships. A pop-up label displays additional information for the user.
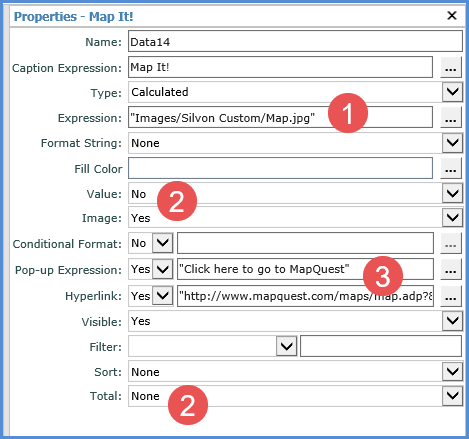
The Map It! measure item was defined as follows:
 |
Expression – In this example, the image resides in a subfolder of the Stratum.Viewer Images folder called “Silvon Custom”. The full expression defines the relative path to the image: "Images/Silvon Custom/Map.jpg" |
 |
Value – Set to No. Image – Set to Yes (required to display the image defined by the expression). Total – Set to None. |
|
Pop-up Label Expression – Here’s the expression for the pop-up label: “Click here to go to MapQuest” Hyperlink – Here’s the expression used for the Map It! hyperlink: "http://www.mapquest.com/maps/map.adp?&city=" + [Customer Sold-To].[Customer Sold-To].CurrentMember.Properties("SldTo City") + "&state=" + [Customer Sold-To].[Customer Sold-To].CurrentMember.Properties("SldTo Province State") + "&zipcode=" + [Customer Sold-To].[Customer Sold-To].CurrentMember.Properties("SldTo Postal Code") + "&country=US&cid=lfmaplink" |
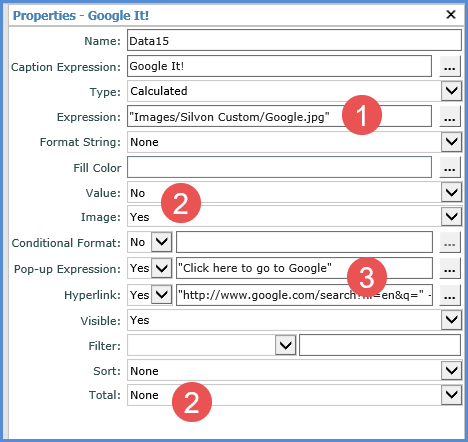
The Google It! measure item was defined as follows:
|
Expression – In this example, the image resides in a subfolder of the Stratum.Viewer Images folder called “Silvon Custom”. The full expression defines the relative path to the image: "Images/Silvon Custom/google.jpg" |
|
Value – Set to No. Image – Set to Yes (required to display the image defined by the expression). Total – Set to None. |
|
Pop-up Label Expression – Here’s the expression for the pop-up label: “Click here to go to Google” Hyperlink – Here’s the expression used for the Google It! hyperlink: "http://www.google.com/search?hl=en&q=" + [Customer Sold-To].[Customer Sold-To].CurrentMember.Properties("SldTo Long Description") |
These tables have example expressions that can be used as models when you are setting up expressions for dynamic user lists.
Note: These same types of expressions can be used when creating expression filters on levels in views. See Example Expressions for Filtering Levels.
For each type of user list expression that follows, a specific example for the Product level is provided followed by the generic MDX format for that type of user list.
Returns Members that are... |
Example Expression and MDX |
Equal to X |
[Product].[Product].CurrentMember IS [Product].[Product].[Product].[954023] Returns the Product member with a value equal to 954023 Generic MDX Format [DimensionName].[HierarchyName].CurrentMember IS [DimensionName].[HierarchyName].[LevelName].[value] |
Not equal to X |
[Product].[Product].CurrentMember.Name <> "954023" Returns Product members with values not equal to 954023 Generic MDX Format [DimensionName].[HierarchyName].CurrentMember.Name <> "value" |
Greater than X |
[Product].[Product].CurrentMember.Name > "954023" Returns Product members with values greater than 954023 Generic MDX Format [DimensionName].[HierarchyName].CurrentMember.Name > "value" |
Greater than or equal to X |
[Product].[Product].CurrentMember.Name >= "954023" Returns Product members with values greater than or equal to 954023 Generic MDX Format [DimensionName].[HierarchyName].CurrentMember.Name >= "value" |
Less than X
|
[Product].[Product].CurrentMember.Name < "954023" Returns Product members with values less than 954023 Generic MDX Format [DimensionName].[HierarchyName].CurrentMember.Name < "value" |
Less than or equal to X |
[Product].[Product].CurrentMember.Name <= "954023" Returns Product members with values less than or equal to 954023 Generic MDX Format [DimensionName].[HierarchyName].CurrentMember.Name <= "value" |
In the specified range |
[Product].[Product].CurrentMember.Name >= "954023" AND [Product].[Product].CurrentMember.Name <= "954622" Returns Product members with values greater than or equal to 954023 and less than or equal to 954622 Generic MDX Format [DimensionName].[HierarchyName].CurrentMember.Name >= "value" AND [DimensionName].[HierarchyName].CurrentMember.Name <= "value" |
Equal to X OR equal to Y |
[Product].[Product].CurrentMember IS [Product].[Product].[Product].[954023] OR [Product].[Product].CurrentMember IS [Product].[Product].[Product].[954622] Returns Product members with values equal to 954023 or 954622 Generic MDX Format [DimensionName].[HierarchyName].CurrentMember IS [DimensionName].[HierarchyName].[LevelName].[value 1] OR [DimensionName].[HierarchyName].CurrentMember IS [DimensionName].[HierarchyName].[LevelName].[value 2] |
For each type of user list expression that follows, a specific example for the Customer ShipTo level is provided followed by the generic MDX format for that type of user list.
Return
Members with |
Example Expression and MDX |
Are equal to the specified text |
[Customer Ship To].[Customer Ship To].CurrentMember.Properties("State") = "IL" Returns Customer ShipTo members with State equal to “IL” Generic MDX Format [DimensionName].[HierarchyName].CurrentMember.Properties("AttributeRelationshipName") = "value" |
Contain the specified text |
(INSTR(1, [Customer ShipTo].[Customer ShipTo].CurrentMember.Properties("ShpTo Postal Code"), "8121") <> 0) Returns Customer ShipTo members with Postal Codes that contain the text “8121" Generic MDX Format (INSTR(1, [DimensionName].[HierarchyName].CurrentMember.Properties("AttributeRelationshipName"), "value") <> 0) |
Don't contain the specified text |
(INSTR(1, [Customer ShipTo].[Customer ShipTo].CurrentMember.Properties("ShpTo Postal Code"), "2") = 0) Returns Customer ShipTo members with Postal Codes that don't contain the text “2” Generic MDX Format (INSTR(1, [DimensionName].[HierarchyName].CurrentMember.Properties("AttributeRelationshipName"), "value") = 0 |
Begin with the specified text |
LEFT([Customer ShipTo].[Customer ShipTo].CurrentMember.Properties("ShpTo Postal Code"), 3) = "481" Returns Customer ShipTo members with Postal Codes that start with the 3 characters “481” Generic MDX Format LEFT([DimensionName].[HierarchyName].CurrentMember.Properties("AttributeRelationshipName"), #) = "value" The # in the generic format is the length of the string of characters for the specified value text. For example, if the value was "4812" rather than "481" in the Customer ShipTo example, then the # would have been 4 rather than 3 in that expression. |
Example 1
This example uses a URL only in the hyperlink expression. Clicking the hyperlink in the related view will access the Mapquest home page.
"http://www.mapquest.com"
Example 2 and 3
The next examples include view information in the hyperlink expression. In the first example, several attribute relationships for Customer Sold-To are used in the expression. The city, state, and postal code information derived from the current member are used as parameter values in the URL.
"http://www.mapquest.com/maps/map.adp?&city=" + [Customer Sold-To].[Customer Sold-To].CurrentMember.Properties("SldTo City") + "&state=" + [Customer Sold-To].[Customer Sold-To].CurrentMember.Properties("SldTo Province State") + "&zipcode=" + [Customer Sold-To].[Customer Sold-To].CurrentMember.Properties("SldTo Postal Code") + "&country=US&cid=lfmaplink"
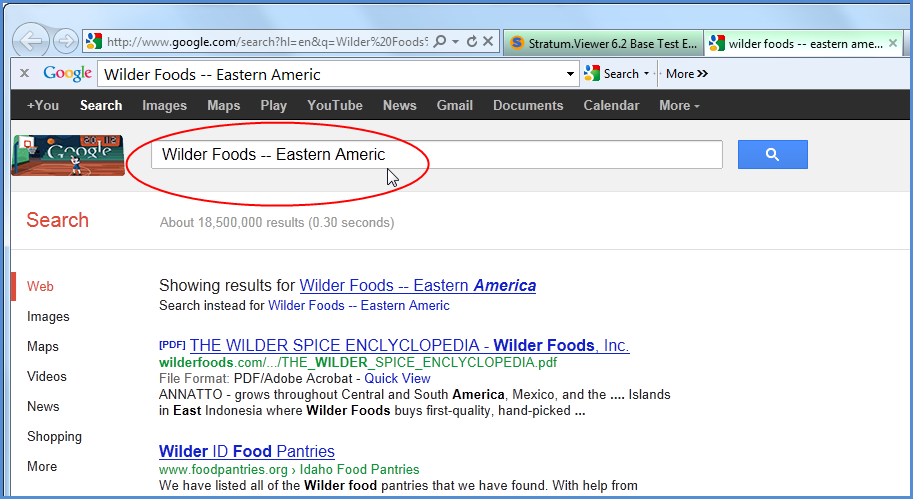
The second example has syntax that first checks to see if a particular attribute relationship exists. If so, the hyperlink opens to Google and searches on that attribute relationship. The SldTo Long Description is the attribute relationship used in the expression.
Iif([Customer Sold-To].[Customer Sold-To].CurrentMember.Properties("SldTo Long Description")=null, null, "http://www.google.com/search?hl=en&q=" + [Customer Sold-To].[Customer Sold-To].CurrentMember.Properties("SldTo Long Description"))
Example 1
This example opens another view and runs it based on that view definition only. The Stratum.Viewer URL and ID for the view are used in the expression. See also Passing Parameters into Views via URL’s for additional parameters that can be used in these expressions.
“http://silvonxyz:60001/ViewWindow.aspx?ViewId=10391”
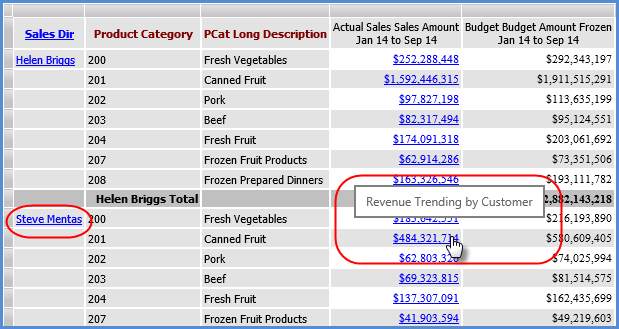
Here is a view containing the hyperlink.
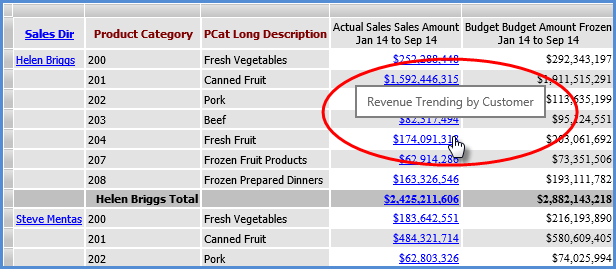
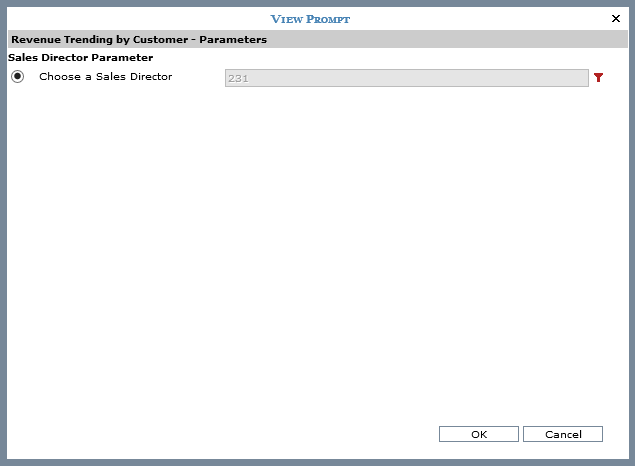
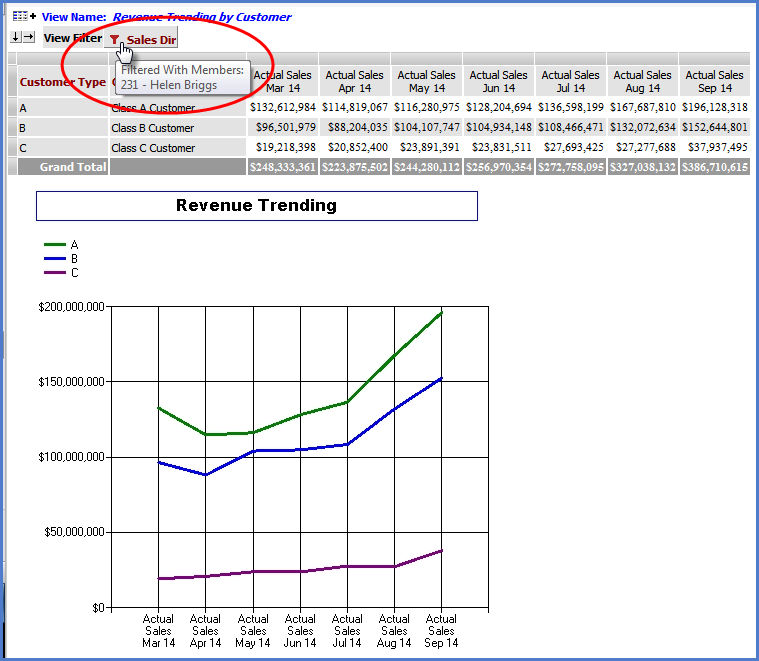
Here is the other view, Revenue Trending by Customer, which will open and prompt you to choose a sales director for which you want to see view data. The prompting comes from parameters tied to a level in the View Filter of the view.
Example 2
The previous expression is then adjusted to pass sales director information from the original view to the other view. The hyperlink will open the view and filter it for the sales director associated with the measure item value that was clicked.
"http://silvonxyz:60001/ViewWindow.aspx?ViewId=10391&vp:SalesDirector="+[Sales Director].[Sales Director].CurrentMember.name+ ""
The hyperlink is clicked for the measure item value of sales director Steve Mentas.
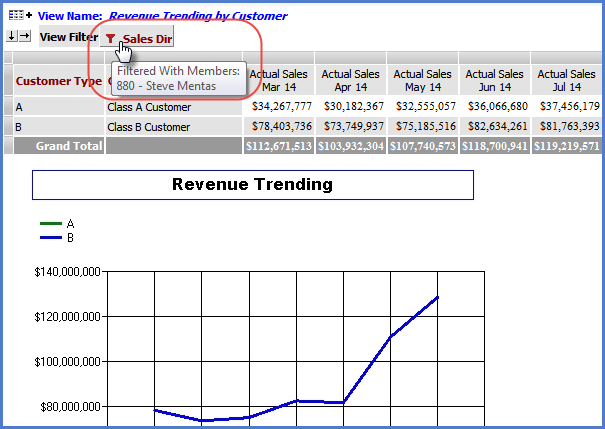
The trending view opens and is filtered for that particular sales director. No prompting to choose a parameter occurs because the hyperlink determines the sales director to use in the filter.
Expression filters that reference member values and attribute relationships were used to filter levels in the following examples. The levels referenced in the filters need to be visible in the view in order for the filters to impact the view.
Note: These same types of expressions can be used when creating dynamic user lists. For more example expressions, see Example Dynamic User List Expressions.
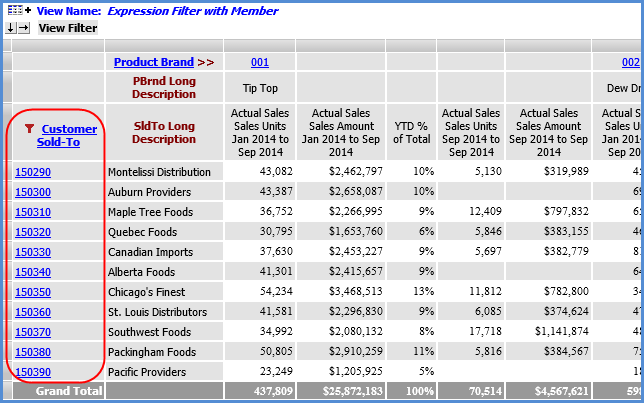
This expression returns Customer Sold-To members with values greater than 150280. You can adjust the filter quickly to return different results by changing out the > symbol in the expression for other symbols (such as <) or by changing the "150280" in the expression to a different value.
[Customer Sold-To].[Customer Sold-To].CurrentMember.Name > "150280"
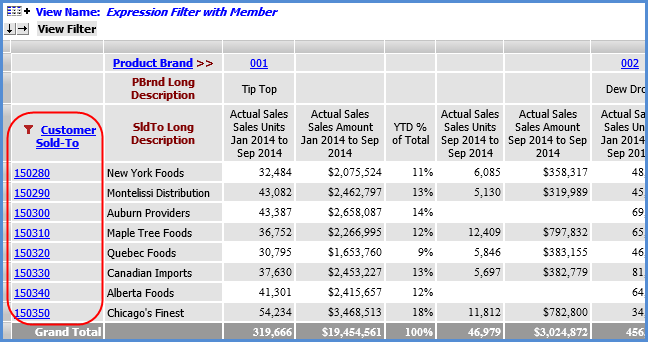
This expression filter returns Customer Sold-To members in a range that is greater than or equal to 150280 and less than or equal to 150350.
[Customer Sold-To].[Customer Sold-To].CurrentMember.Name >= "150280" AND [Customer Sold-To].[Customer Sold-To].CurrentMember.Name <= "150350"
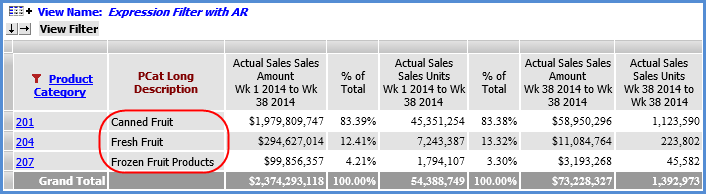
This filter returns Product Category members that have the text 'fruit' in their PCat Long Description attribute relationship.
(INSTR(1, [Product Category].[Product Category].CurrentMember.Properties("PCat Long Description"), "Fruit") <> 0)
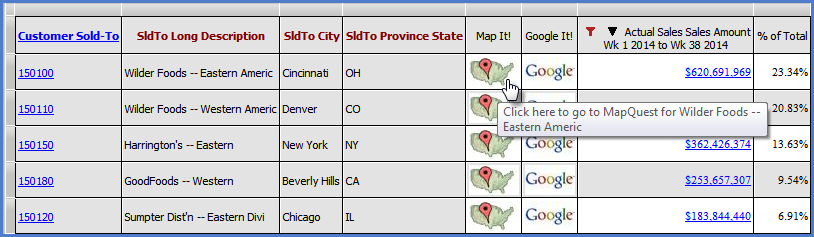
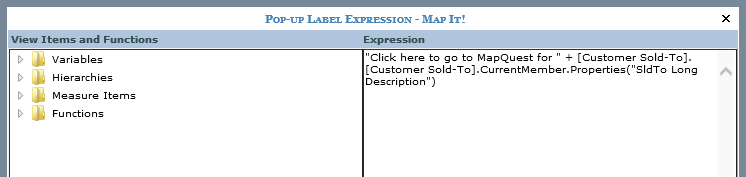
This expression uses static text in combination with information from the view. The pop-up label will vary as you click on each Map It! measure item value based on corresponding Customer Sold-To member information.
"Click here to go to MapQuest for " + [Customer Sold-To].[Customer Sold-To].CurrentMember.Properties("SldTo Long Description")
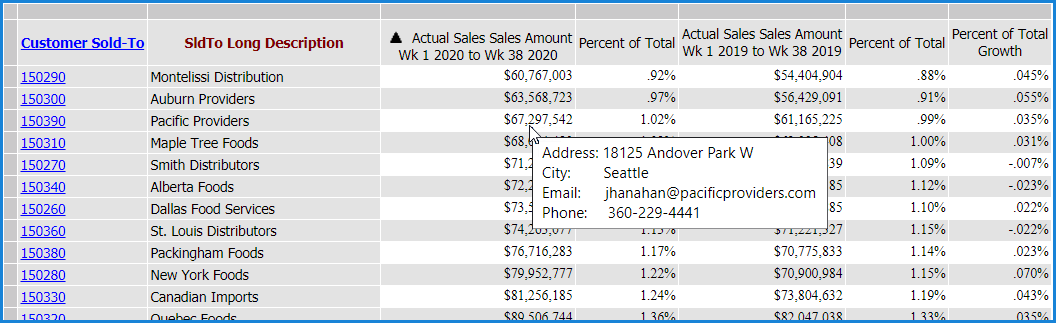
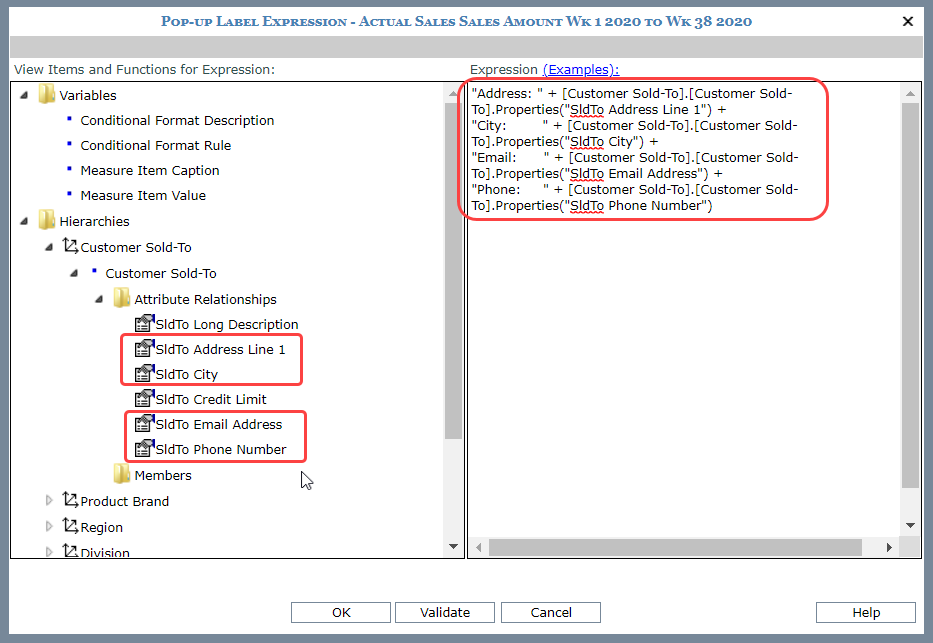
This example creates a pop-up label consisting of multiple lines of text to display descriptive information (attribute relationships) for a dimension in the view. Putting the attribute information in a pop-up label rather than in columns of the view saves some room.
Here’s the example expression. The text in quotes at the beginning of each line of the expression is static text. The next part in each line of the expression are Customer Sold-To attribute relationships.
“Address: " + [Customer Sold-To].[Customer Sold-To].Properties("SldTo Address Line 1") +
“City: " + [Customer Sold-To].[Customer Sold-To].Properties("SldTo City") +
“Email: " + [Customer Sold-To].[Customer Sold-To].Properties("SldTo Email Address") +
“Phone: " + [Customer Sold-To].[Customer Sold-To].Properties("SldTo Phone Number")
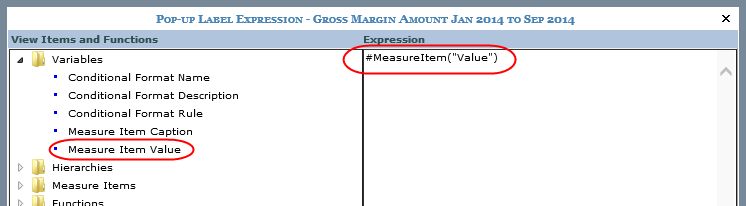
This expression uses only the Measure Item Value variable.
#MeasureItem(“Value”)
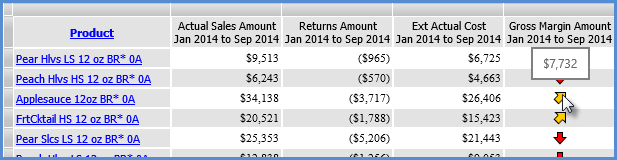
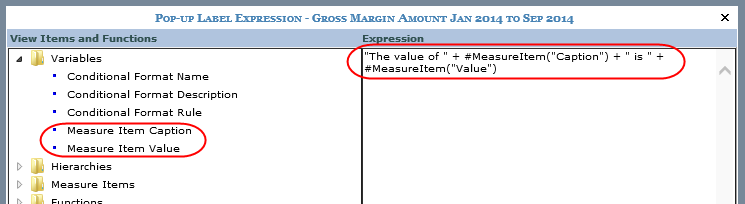
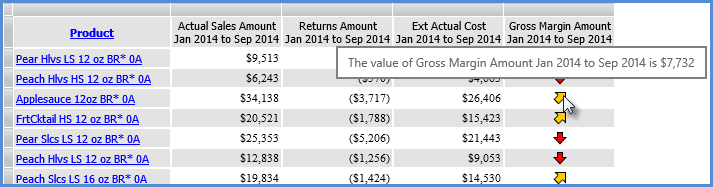
This expression uses static text in combination with the two Measure Item variables.
"The value of " + #MeasureItem("Caption") + " is " + #MeasureItem("Value")
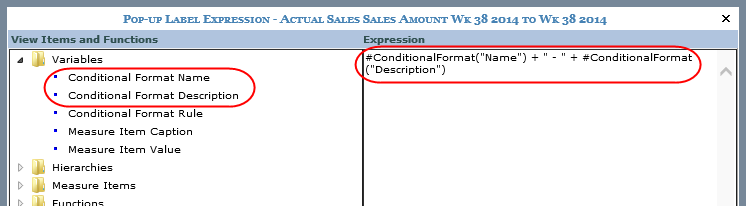
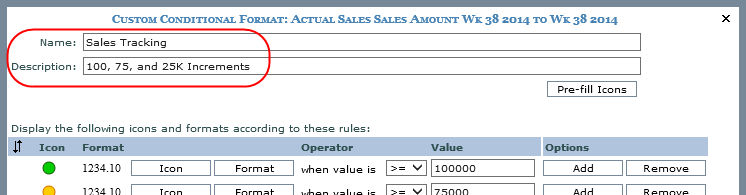
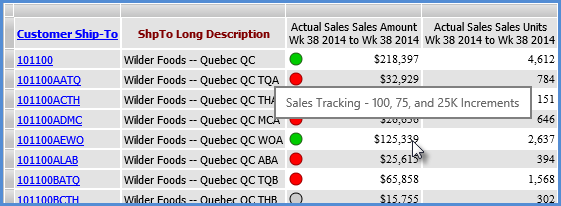
This expression uses two of the Conditional Format variables separated by static text (a dash mark). The pop-up label is for a measure item that has a conditional format defined for it.
#ConditionalFormat("Name") + " - " + #ConditionalFormat("Description")
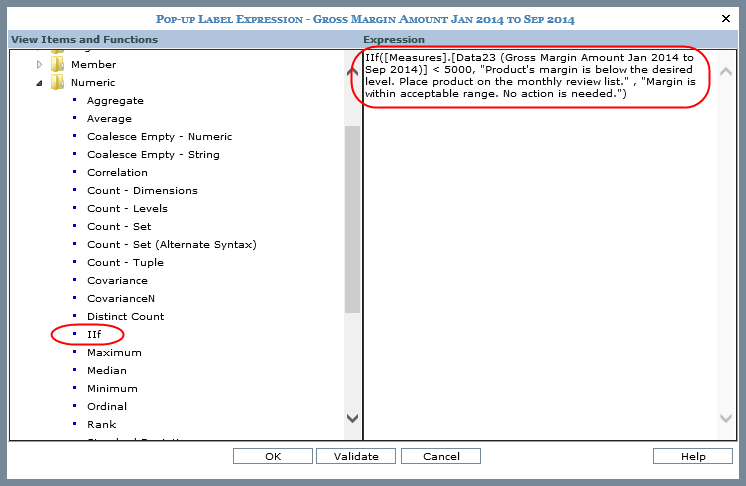
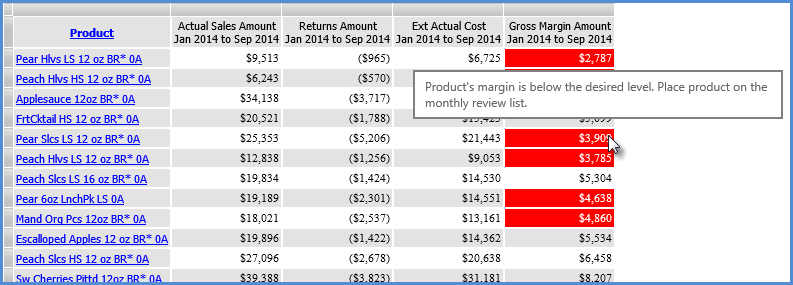
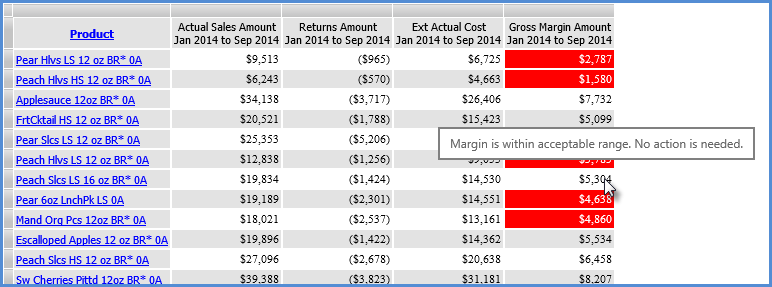
This expression uses the IIf function to define a conditional expression. The label will display one of two statements depending on the conditions in the view grid. If Gross Margin Amount is less than $5,000, the first statement will display. If the margin is greater than $5,000, then the second statement will display.
IIf([Measures].[Data23 (Gross Margin Amount Jan 2014 to Sep 2014)] < 5000, "Product's margin is below the desired level. Place product on the monthly review list." , "Margin is within acceptable range. No action is needed.")
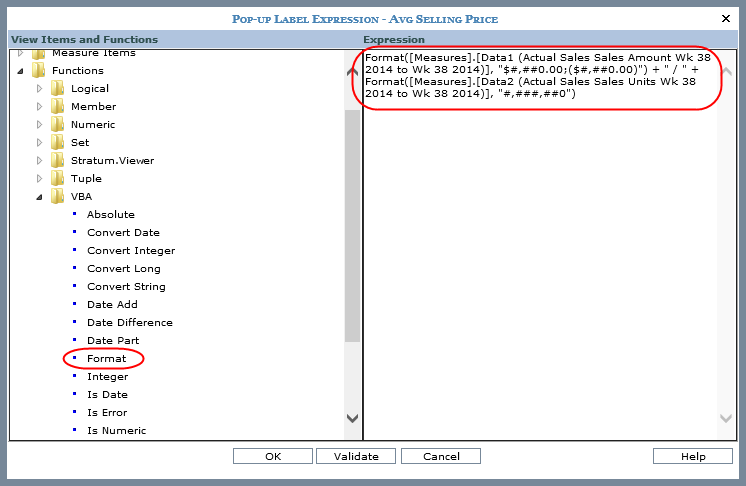
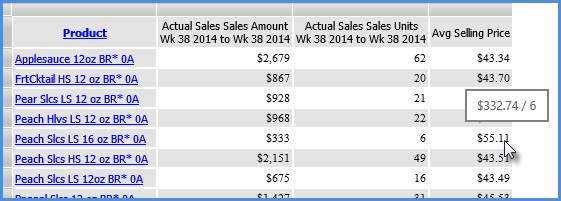
This expression displays the value of a sales amount measure item followed by a division sign and the value of a sales units measure item. The VBA Format function is used to control the display format of the values in the pop-up label. The pop-up label is meant to show the values behind a calculated measure item’s results.
Format([Measures].[Data1 (Actual Sales Sales Amount Wk 38 2014 to Wk 38 2014)], "$#,##0.00;($#,##0.00)") + " / " + Format([Measures].[Data2 (Actual Sales Sales Units Wk 38 2014 to Wk 38 2014)], "#,###,##0")
These examples show how to create period based views that display rolling “N” periods. This is done by creating a level filter on a time hierarchy. The time range property for the view in both examples was set to No.
The first view is a rolling 12 weeks. It has rows comprised of the two levels from the Year Weeks time hierarchy. The Weeks level has a Rolling “12” filter on it that calculates the current week and prior 11 weeks. The filter returns Week 38 back through Week 27 in this example.
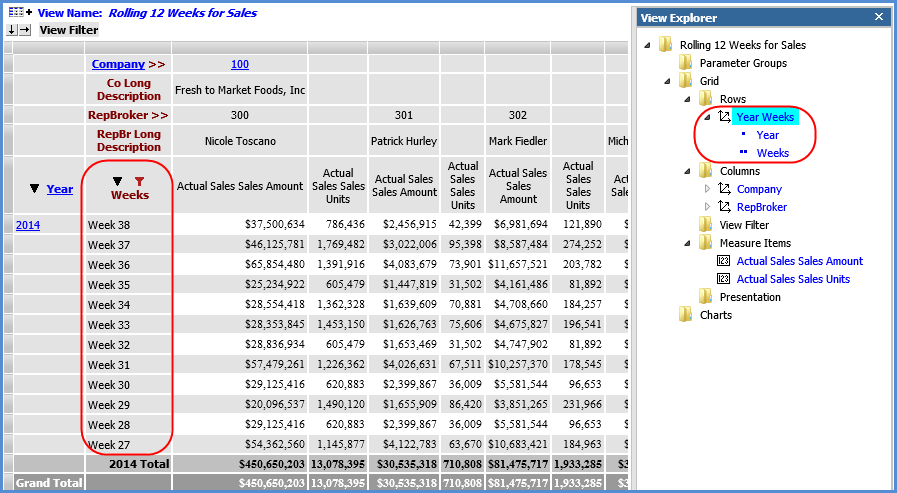
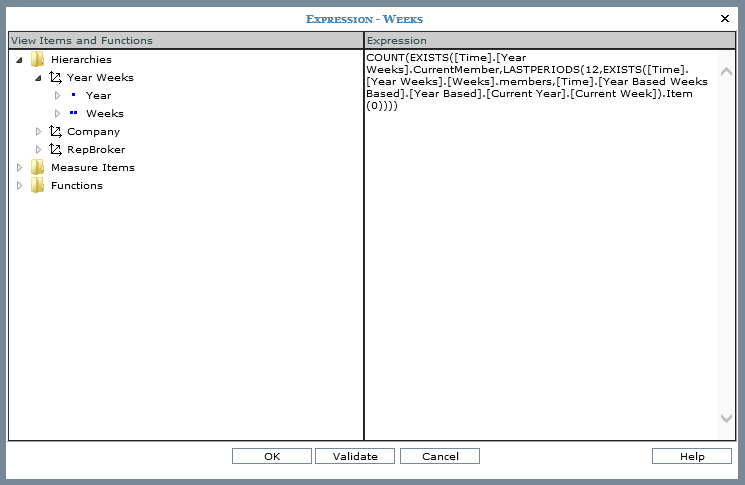
The expression for the level filter is:
COUNT(EXISTS([Time].[Year Weeks].CurrentMember,LASTPERIODS(12,EXISTS([Time].[Year Weeks].[Weeks].members,[Time].[Year Based Weeks Based].[Year Based].[Current Year].[Current Week]).Item(0))))
This expression uses the Year Based Weeks Based hierarchy to determine the Current Week, Current Year.
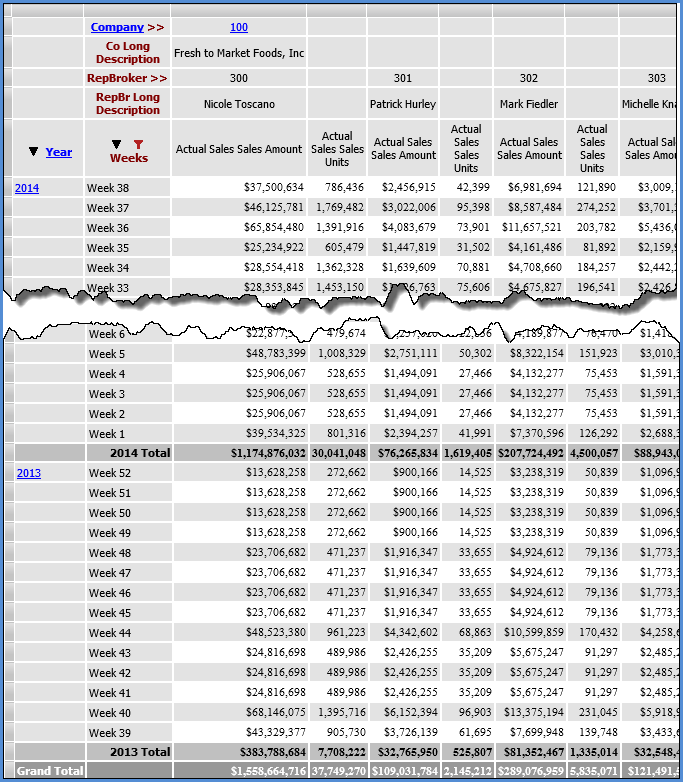
A simple change to the expression changes the view to a rolling 52 weeks. Change the 12 in the expression to 52. It will calculate the current week and prior 51 weeks.
COUNT(EXISTS([Time].[Year Weeks].CurrentMember,LASTPERIODS(52,EXISTS([Time].[Year Weeks].[Weeks].members,[Time].[Year Based Weeks Based].[Year Based].[Current Year].[Current Week]).Item(0))))
Here is the refreshed view after making that change. The filter returns Week 38 of 2014 through Week 39 of 2013.
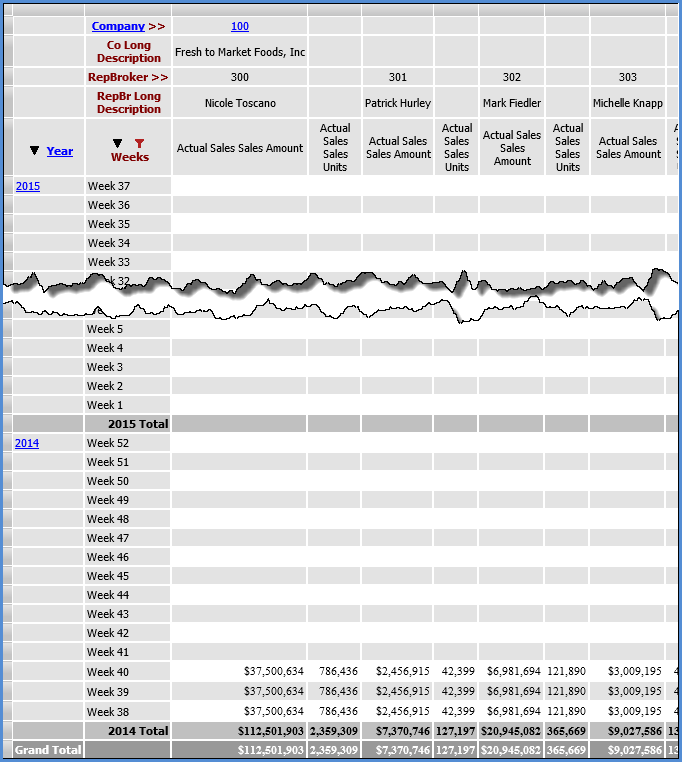
If you want to see rolling periods in the future, use a negative number for the LASTPERIODS part of the expression. Here is the expression when the 52 is changed to -52. It will calculate the current week and next 51 weeks.
COUNT(EXISTS([Time].[Year Weeks].CurrentMember,LASTPERIODS(-52,EXISTS([Time].[Year Weeks].[Weeks].members,[Time].[Year Based Weeks Based].[Year Based].[Current Year].[Current Week]).Item(0))))
Here is the refreshed view after making that change. The filter returns Week 37 of 2015 through Week 38 of 2014. The future weeks for actual sales do not have data yet, so those cells are empty in the view. This type of filter would be useful in views that contain measures that have anticipated future data, such as budget or forecast measures.
How do you compare this year vs. last year with months going down the side of a view and see the % of sales ratio? We get this question from time to time and it’s pretty easy to do. You could do this by describing 24 separate measures and then adding 12 more for a total of 36 that do the calculation between the last year and this year sales. But there is an easier way!
All you need to do is use time as a dimension (or in Stratum terms – set Time Range to No for its measure items) and create three measures that you want to repeat for every month (or week or any other time unit you choose).
Note: See Example 2 if you prefer to see Months across the top of a view in columns rather than down the side of a view in rows.
First – what do you mean – use time as a dimension? This allows you to have measures the automatically repeat for each time unit displayed. Simple example would be displaying sales and units for each month of a year or weeks or days.
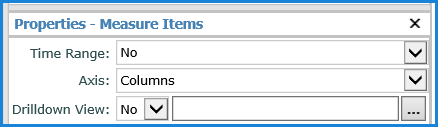
To start – you have to set Time Range to No – this is a property of the Measures Items node in the View Explorer. Easy to do, just right click on Measures Items node in the view explorer window and select Properties – then change the Time Range to No (the default is Yes.
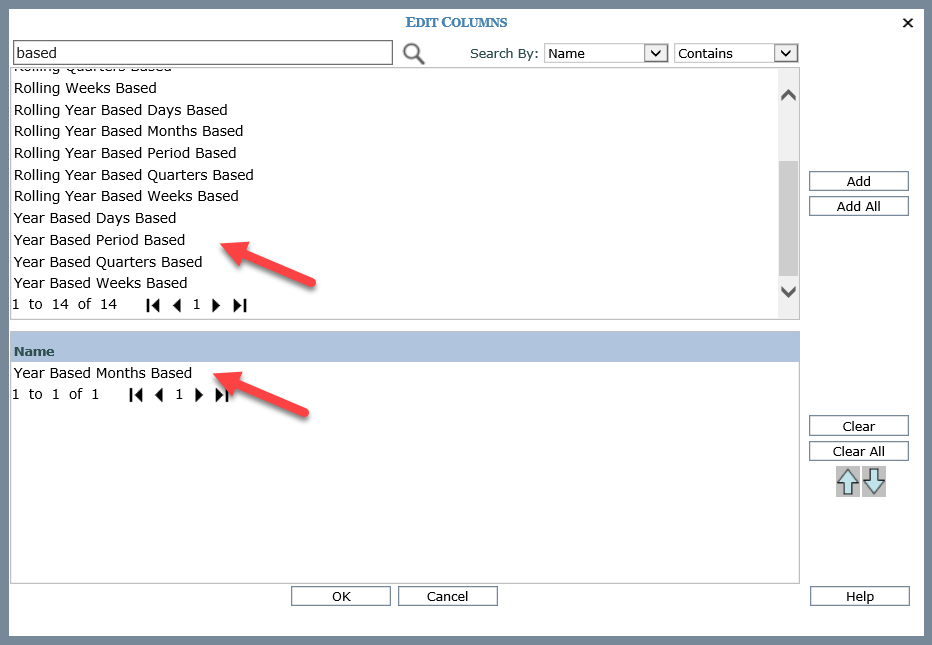
Once you've taken care of setting Time Range to No, you’ll want to include some Time in your view. So instead of having time controlled by column (as in a ‘typical’ view where you select the from and to time for each measure) we are going to have each measure repeated for every time unit we select. In this example, we have years and months. It's always recommended using Based time dimensions like Year Based Months Based since these based (or relative) time dimensions allow you to select Current Year (CY) and Last Year (LY) and will automatically switch years when the year changes. Same with the months – Current Month, Previous Month, etc.
Finally, you add some measures and set up a few calculations. The next two examples show this type of view and the specifics of the calculations that were set up.
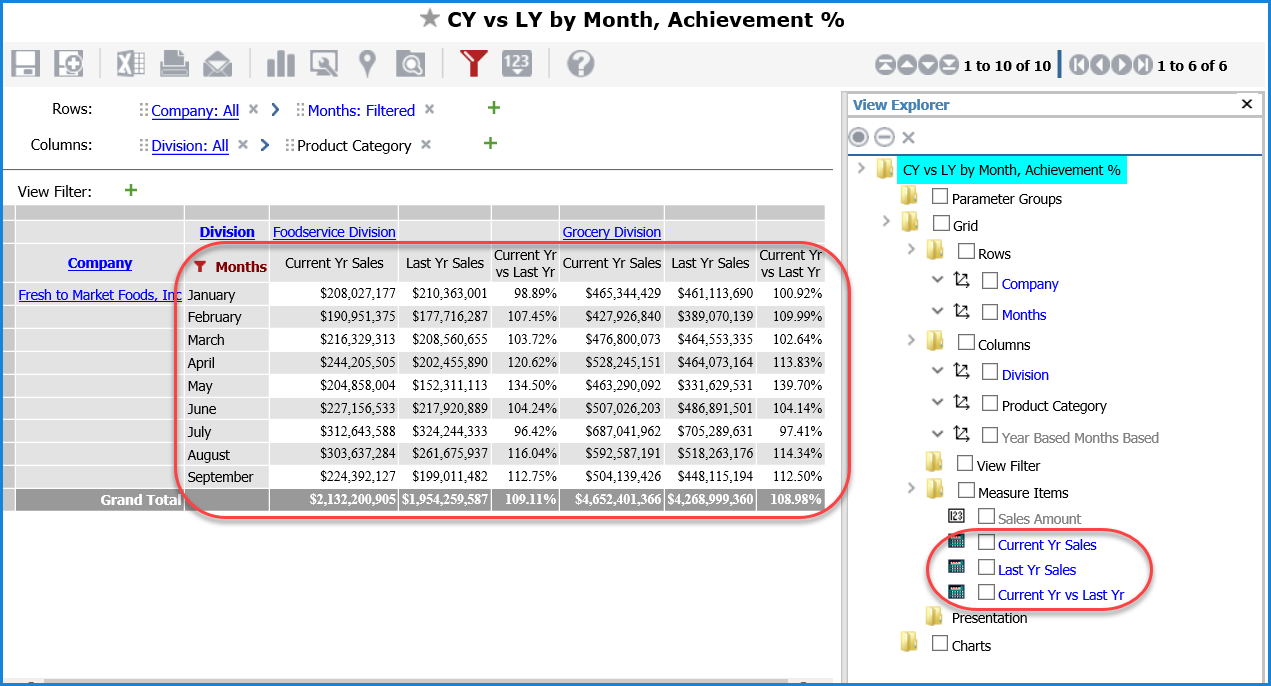
In this example, we used the Year Based Months Based dimension as a hidden dimension (used in our calculations) and the Months dimension. Then we added a Sales Amount measure item as a hidden measure item (used in our calculations), did a couple of calculations to get Current Year (CY) and Last Year (LY), and then we created a % calculation between CY and LY. If we were interested in just a single year – we could just show the Sales Amount measure in the view and we’d be done. But because we are going to select a couple of years, we need to create a simple calculation that filters our CY and LY sales. These calculations are called ‘Tuples’. The calculations are described after this image.
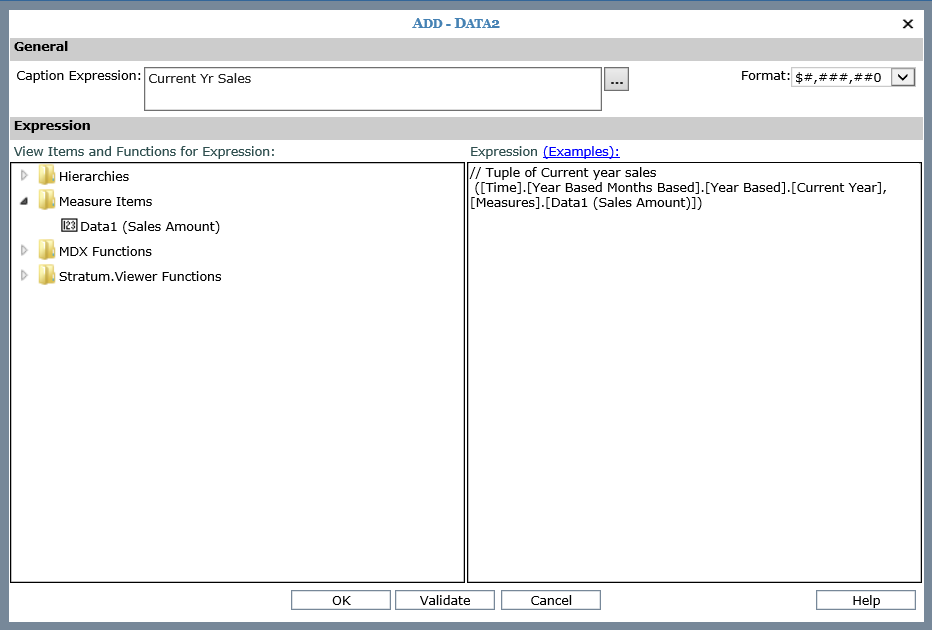
The calculation for Current Year looks like the following. The text preceeded by // is comment text that describes the calculation, and it gets ignored by Viewer. The [Time].[Year Based Weeks Based].[Year Based].[Current Year] is from the dimensions – this is filtering the Time dimension to show only the Current Year. The [Data1 (Sales Amount)] is the Sales Amount measure we want to see. Put a comma between them and add parens at the front and back and you’ve got yourself a Tuple.
// Tuple of Current year sales
([Time].[Year Based Months Based].[Year Based].[Current Year],[Measures].[Data1
(Sales Amount)])
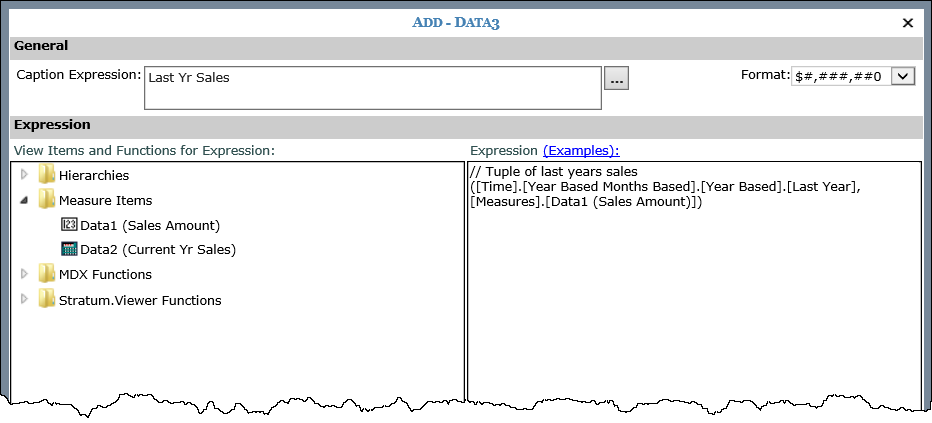
Next, we created the same calculation
for Last Year:
// Tuple of last years sales
([Time].[Year Based Months Based].[Year Based].[Last
Year],[Measures].[Data1 (Sales Amount)])
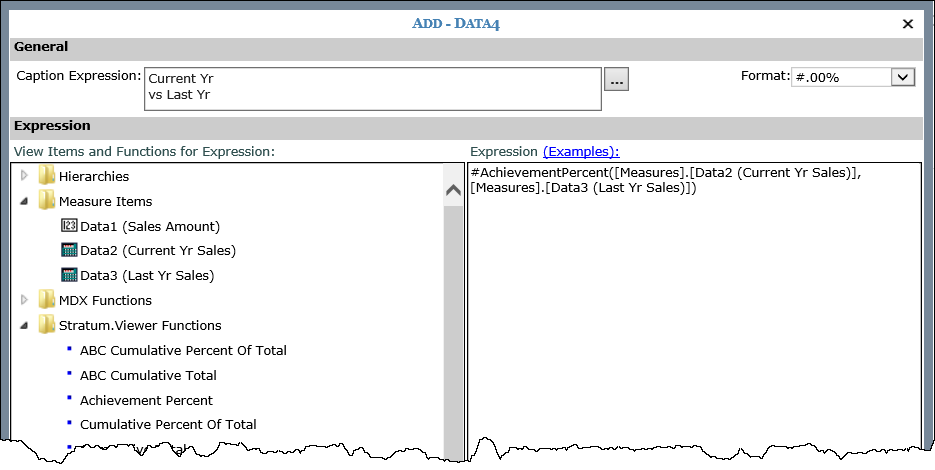
Finally, we created a calculation to do the % calculation using a Stratum function – we used that function so that the divide by zero check is automatically handled. There are some helpful functions in the Stratum.Viewer Functions area of the calculation window, so check them out. You can add formatting and captions too as you set up your calculations using shortcuts in this window.
#AchievementPercent([Measures].[Data2 (Current Yr Sales)], [Measures].[Data3 (Last Yr Sales)])
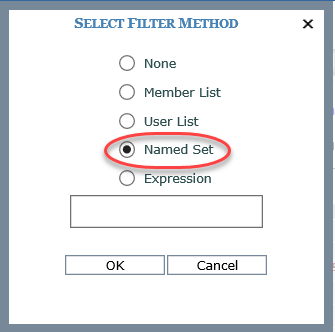
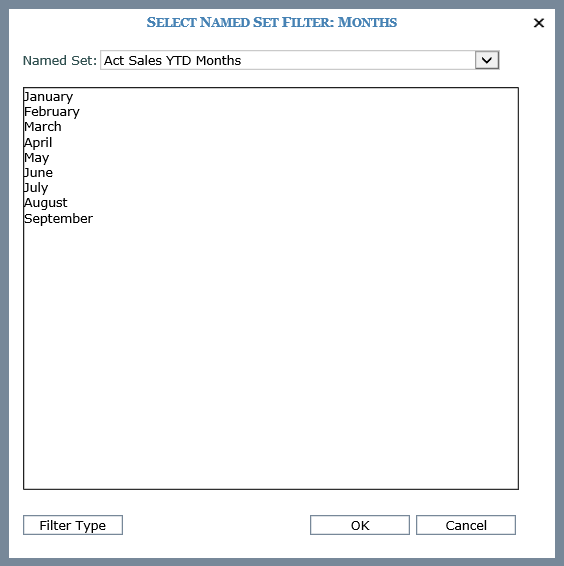
Another helpful technique used in this example is to limit the months of data that get displayed so the view automatically only shows months thru the current month – that way, the future months without sales don’t show up (which is nice when comparing CY to LY particularly in a chart). You can do that using a filter on time such as a Named Set filter. Named sets are available for the Time dimensions like Months, Weeks and Days (without any Year associated with them). Named Sets are a list of time units (Months, Weeks, Days normally) that Stratum automatically updates to include months from the beginning of the year thru the current month. In this example, we right-clicked the Months dimension in the view, then selected Filter and Change Filter Type from the grid pop-up menu. Then we picked Named Set from the Select Filter Method window and picked a sales Named Set since our view is about sales. There is a Named Set for each type of monthly data (sales, budget, etc.).
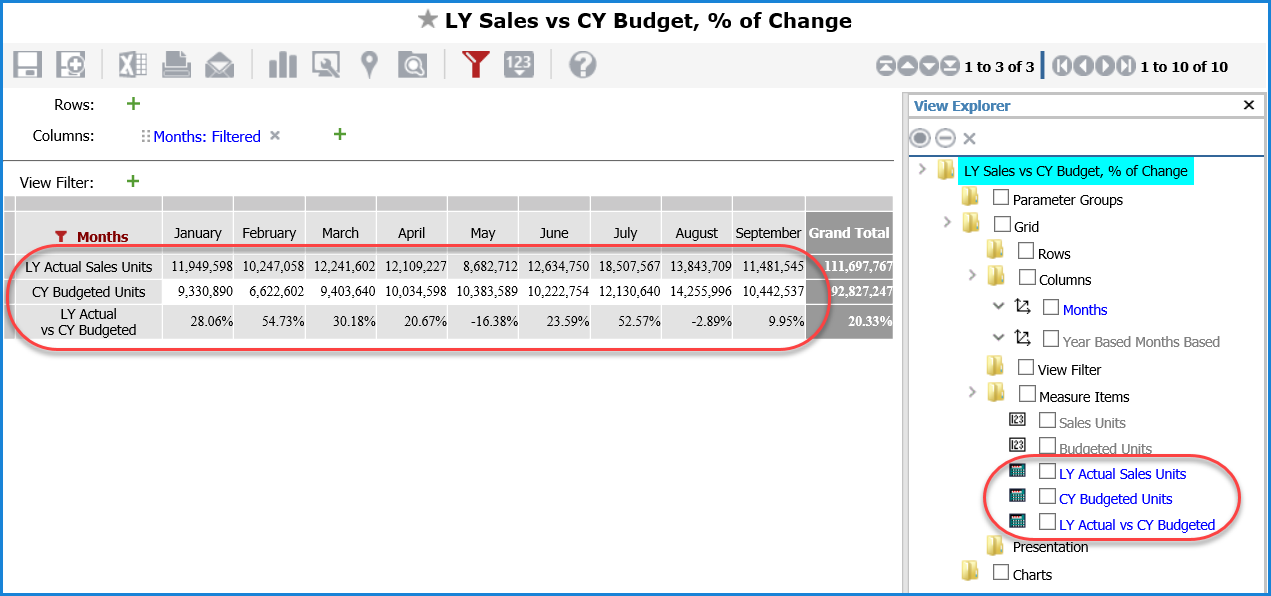
Here's another example using Tuple-based calculations. The layout of this view is slightly different from prior example. We have Months going across the top on columns while the measure items we're comparing are down the side on rows. Notice too we're comparing Sales against Budget from different years. The calculations help us compare the percent of change between Actual Sales Units from one year to Budgeted Units for a different year. Expressions for the three calculations follow this image.
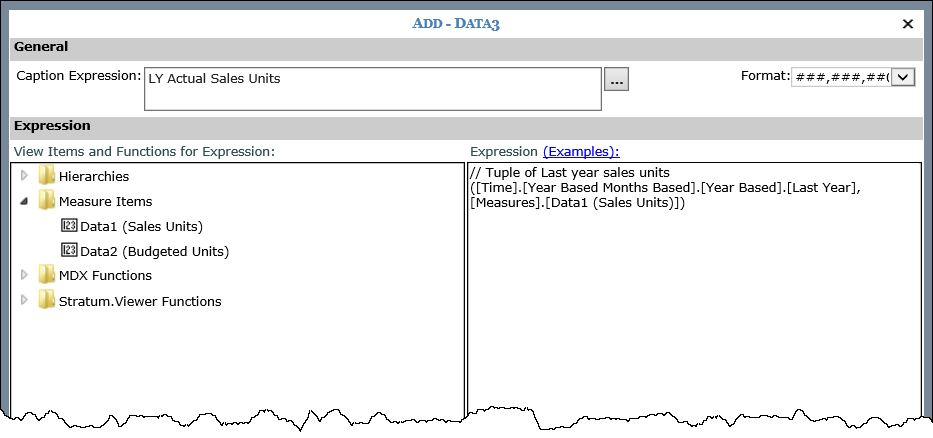
Here is the calculation used for Actual Sales Units for last year.
// Tuple of Last year sales units
([Time].[Year Based Months Based].[Year Based].[Last Year],[Measures].[Data1 (Sales Units)])
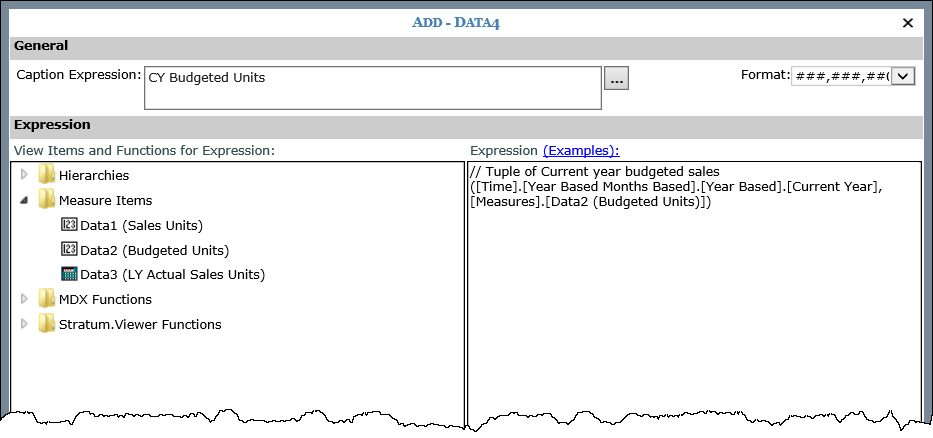
Here is the calculation used for Budgeted Units for the current year.
// Tuple of Current year budgeted sales
([Time].[Year Based Months Based].[Year Based].[Current
Year],[Measures].[Data2
(Budgeted Units)])
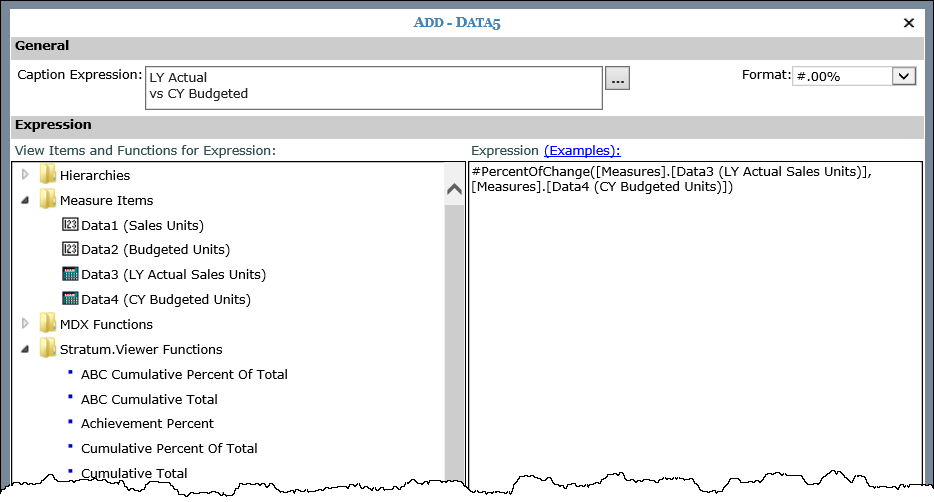
Here is the calculation giving us the % of change between LY Actual Sales Units and CY Budgeted Units. We used the #PercentOfChange function from the Stratum.Viewer Functions folder for this calculation.
#PercentOfChange([Measures].[Data3 (LY Actual Sales Units)], [Measures].[Data4 (CY Budgeted Units)])