The following table lists examples of when to use time ranges and when to use time hierarchies to achieve various types of time analysis in views such as YTD or Rolling N Periods analysis. In most cases, you can achieve the desired analysis using measure items with time ranges. In other cases, time dimensions are recommended. Views showing various examples are on the next few pages
Time Ranges used to… |
Time Hierarchies used to… |
|---|---|
|
|
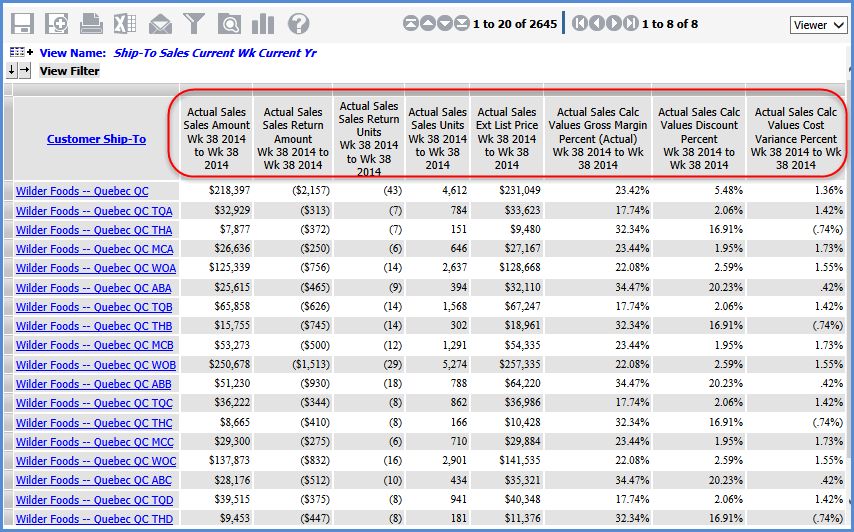
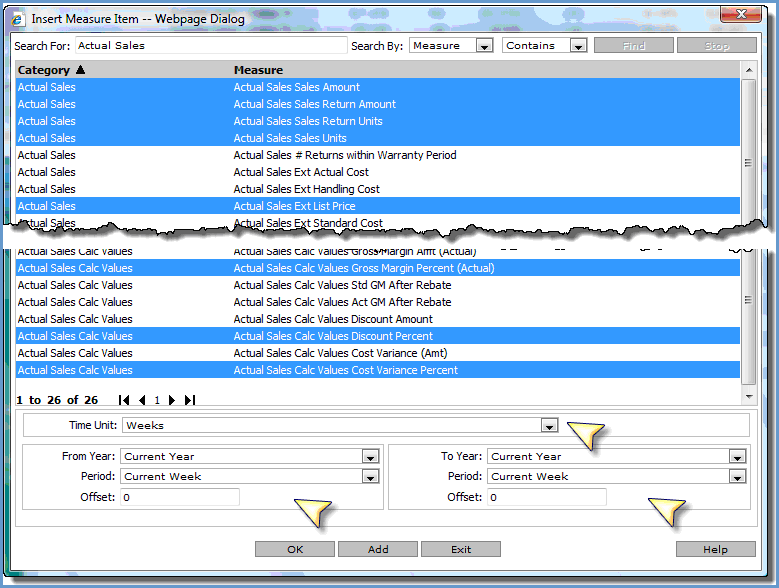
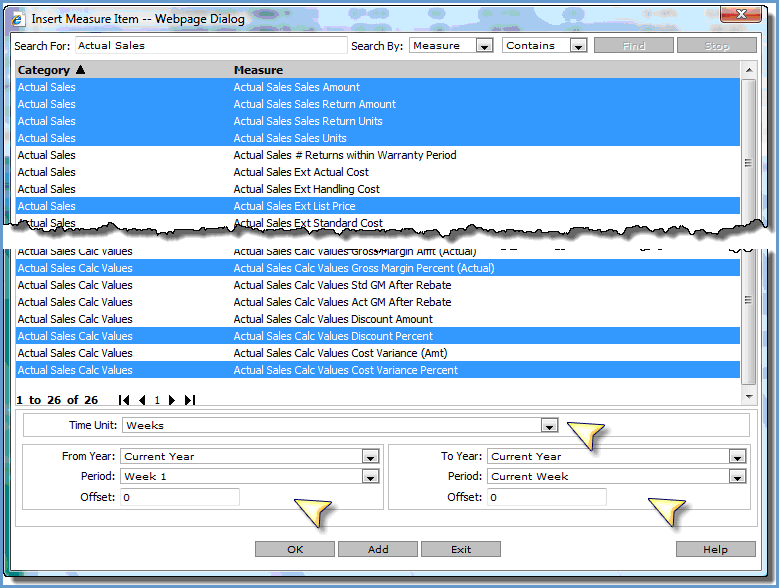
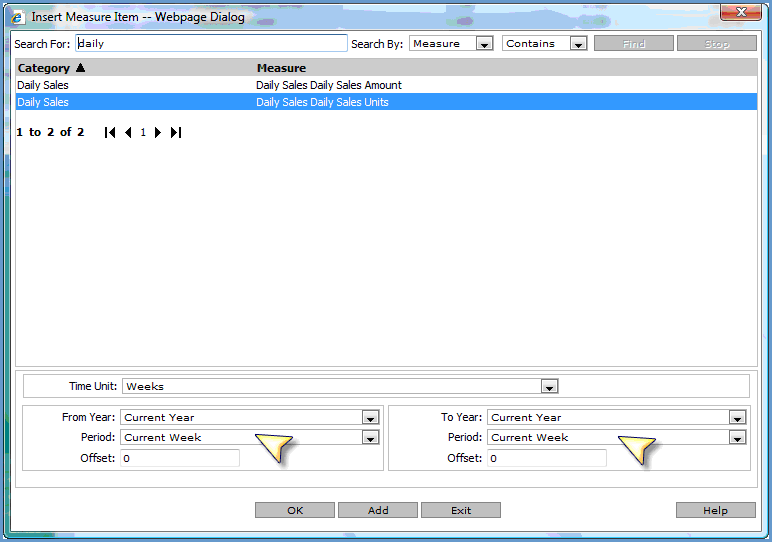
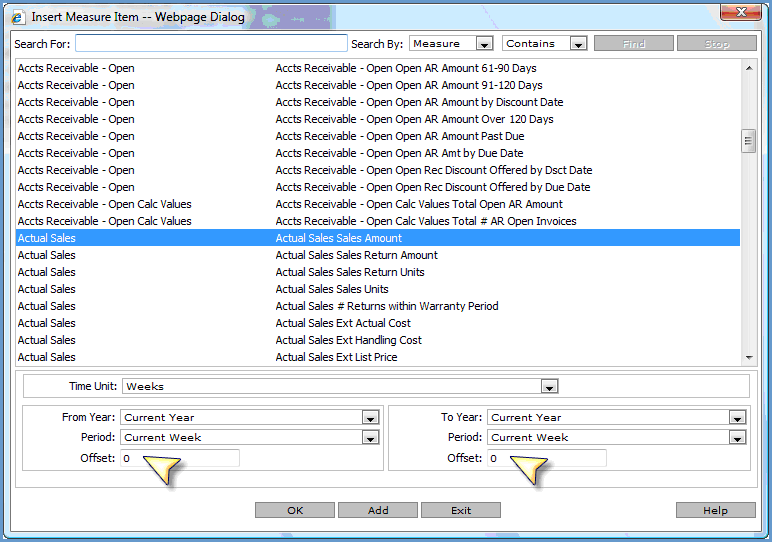
This view displays measure items based on different Actual Sales measures, and all are for the same point in time – the current week of the current year (in this case, Week 38 of 2014).
Time range properties selected for the measure items were:
This view displays measure items based on different Actual Sales measures, and all are for the same point in time – the weeks YTD for the current year (in this case, Week 1 through Week 38 of 2014).
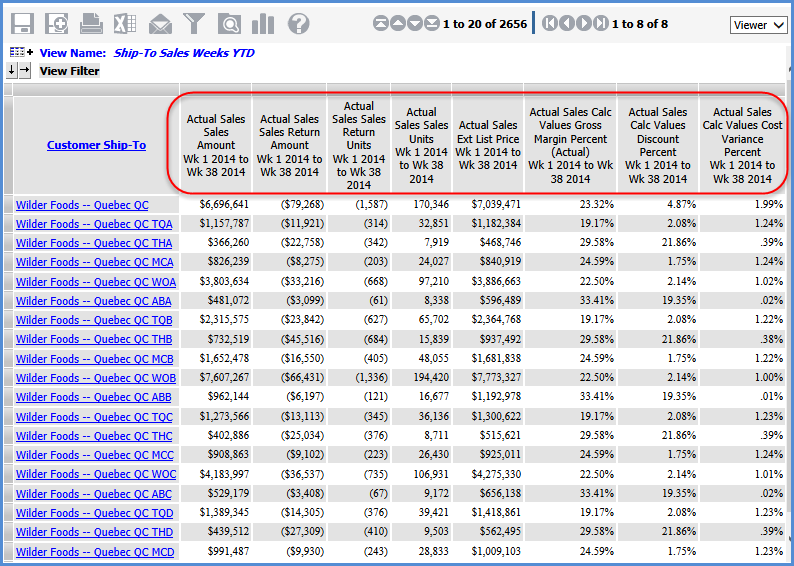
Time range properties selected for the measure items were:
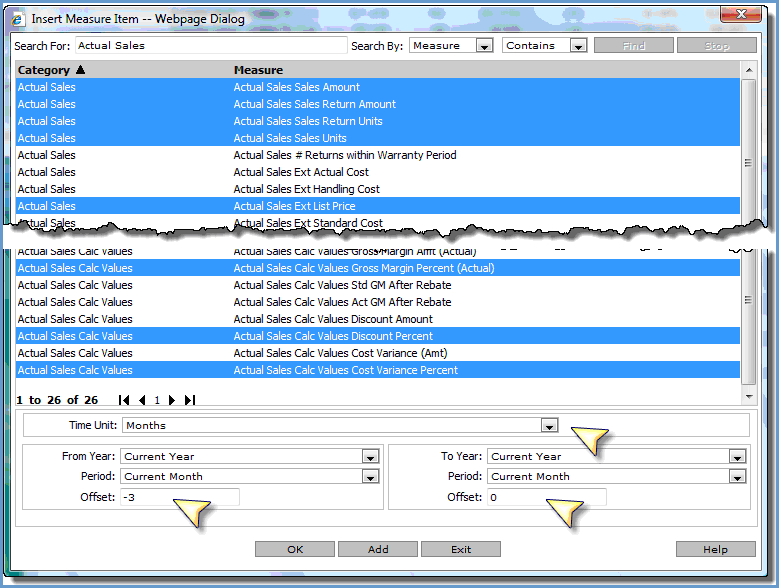
This view displays measure items based on different Actual Sales measures, and all are for the same point in time – the three months prior to the current month of the current year (in this case, June 2014 up to the current month of September 2014).
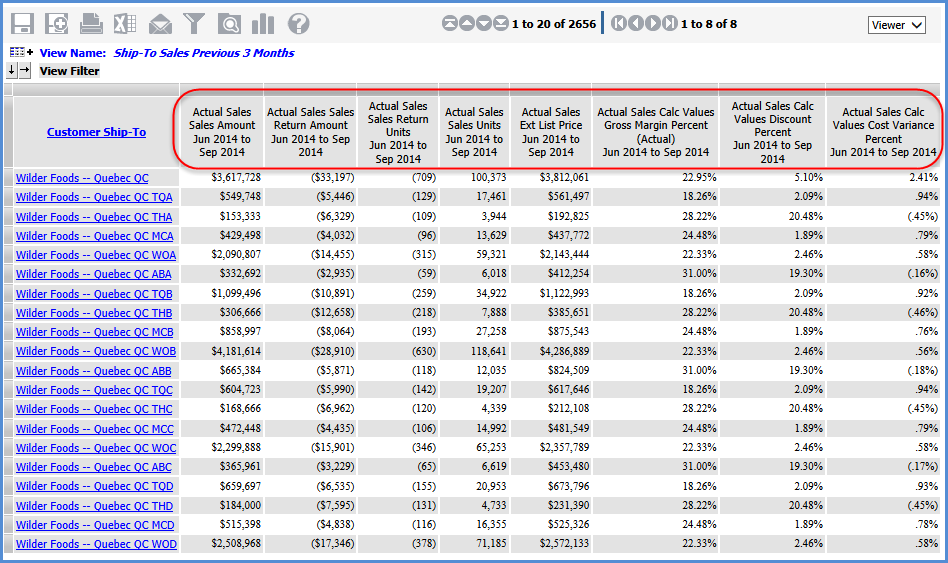
Offsets were used to define part of the time range for the measure items. The “From” point in time was defined by specifying a -3 offset to the Current Month of the Current Year. Here are the rest of the time range properties:
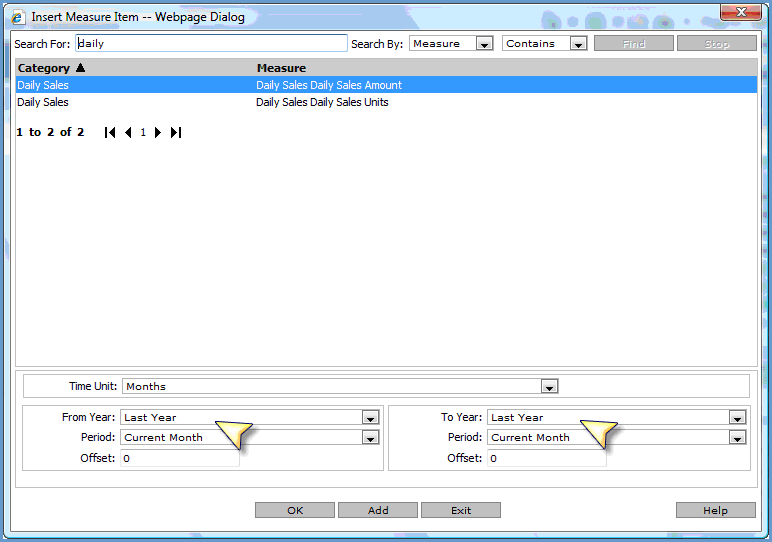
All the measure items in this example are based on the Daily Sales Daily Sales Units measure. The different points in time being analyzed are current week, current month, and YTD – in this case Week 38, September, and January 1 through September 15 of 2014.
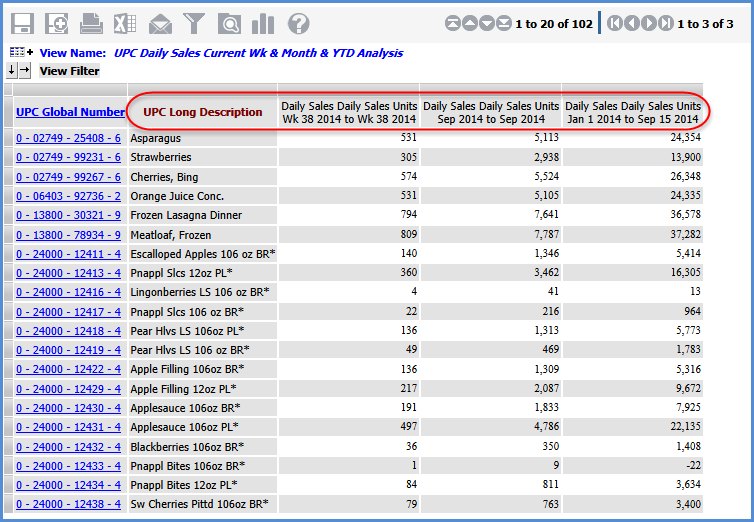
Time range properties for the current week were:
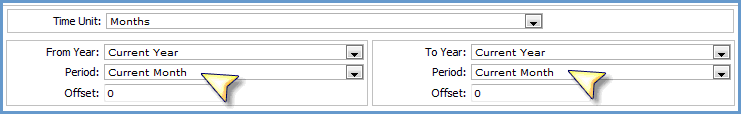
For current month:
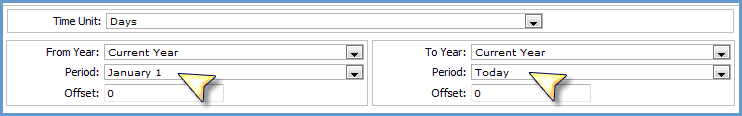
For YTD:
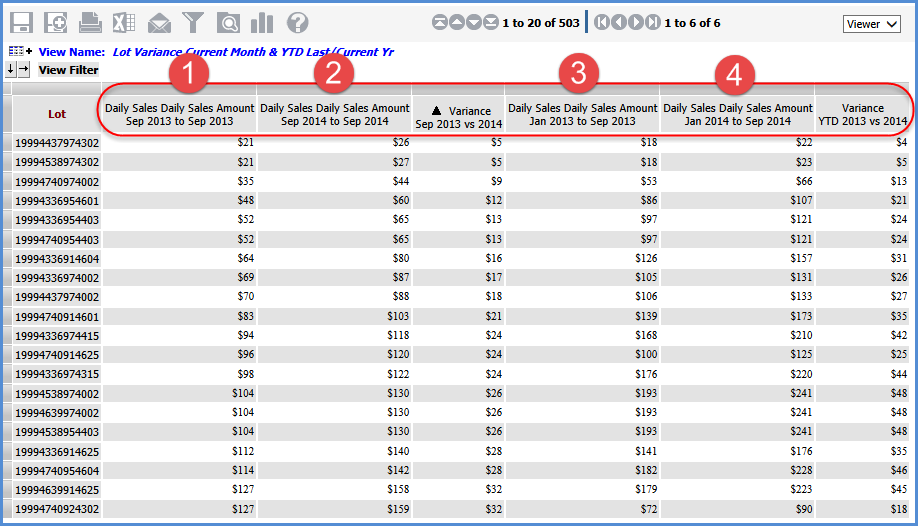
The 4 regular measure items in this example are based on the Daily Sales Daily Sales Amount measure. The different points in time being analyzed are current month of last year and current year, and the YTD for last year and current year (in this case, September of 2013 vs 2014 and YTD 2013 vs 2014). Calculated measure items show the variance amount from last year to current year.
Time range properties for the current month of last year measure item were:
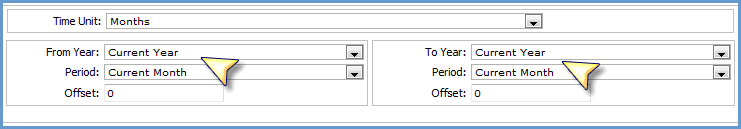
For current month current year:
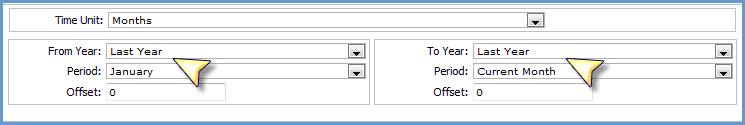
For YTD last year:
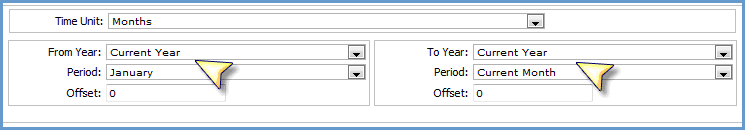
For YTD current year:
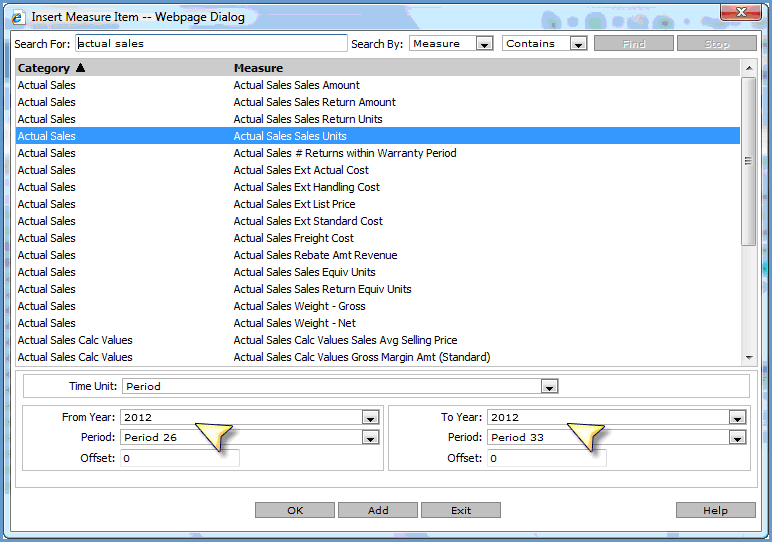
All measure items in this view are based on the Actual Sales Sales Units measure. The same periods for several different years are being analyzed – Period 26 through 33 in 2012, 2013, and 2014. That type of analysis is helpful for comparing unique periods of time year by year, such as comparing seasonal sales promotions year by year.
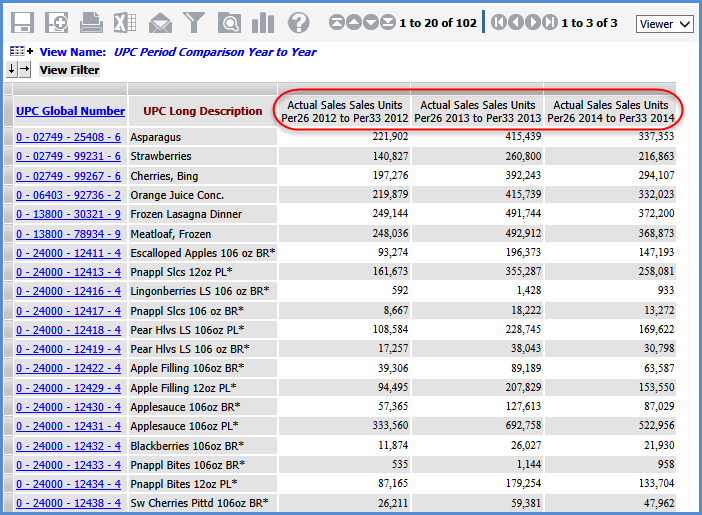
Time range properties for the 2012 measure item were as follows. The other two measure items used the same properties except for 2013 and 2014 as the From Year and To Year.
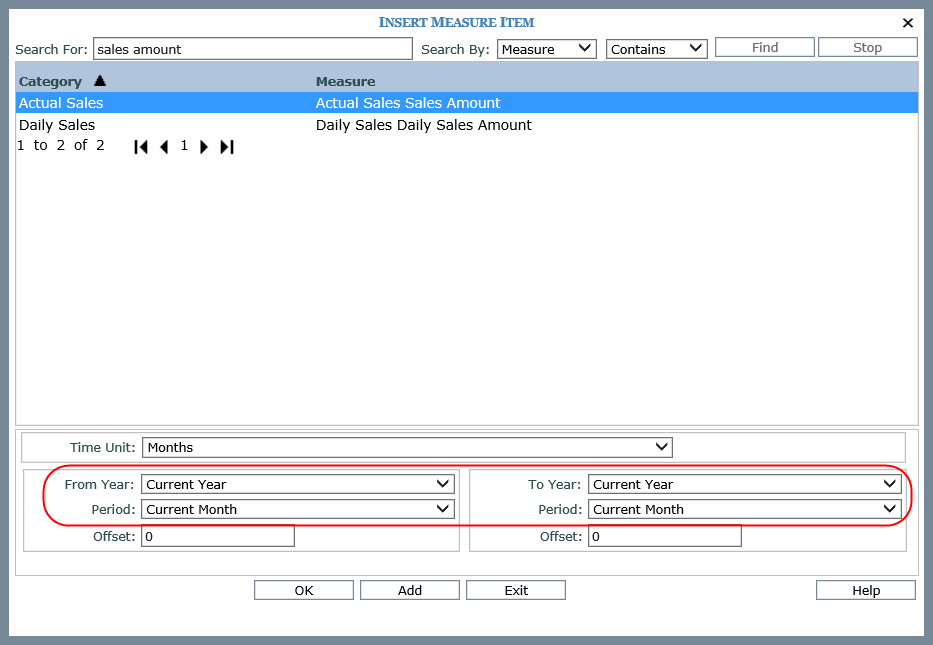
The marked measure item in the following view returns sales for the first month of the current year through the Previous Month of the current year. The Previous Month is the month prior to the one defined as the Current Month in the implementation. In this example, September is the Current Month so the values returned by the measure item represent the total sales amount for January through August of the current year.
For this type of analysis, you should set up a calculated measure item that instructs Stratum.Viewer how to proceed based on what month of the year it is. This is important so that Stratum.Viewer knows how to proceed in cases when the current month and first month of the year are one in the same.
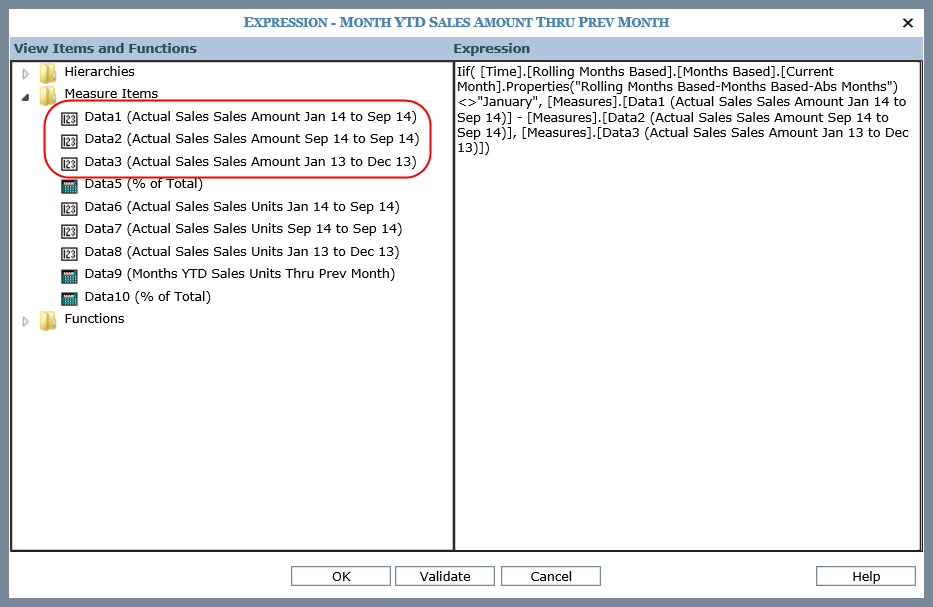
See the details after this view image to learn how to set up a ‘Months YTD Sales through Previous Month’ calculation. The expression for the calculation uses an IIF condition, three regular measure items, and a time dimension.
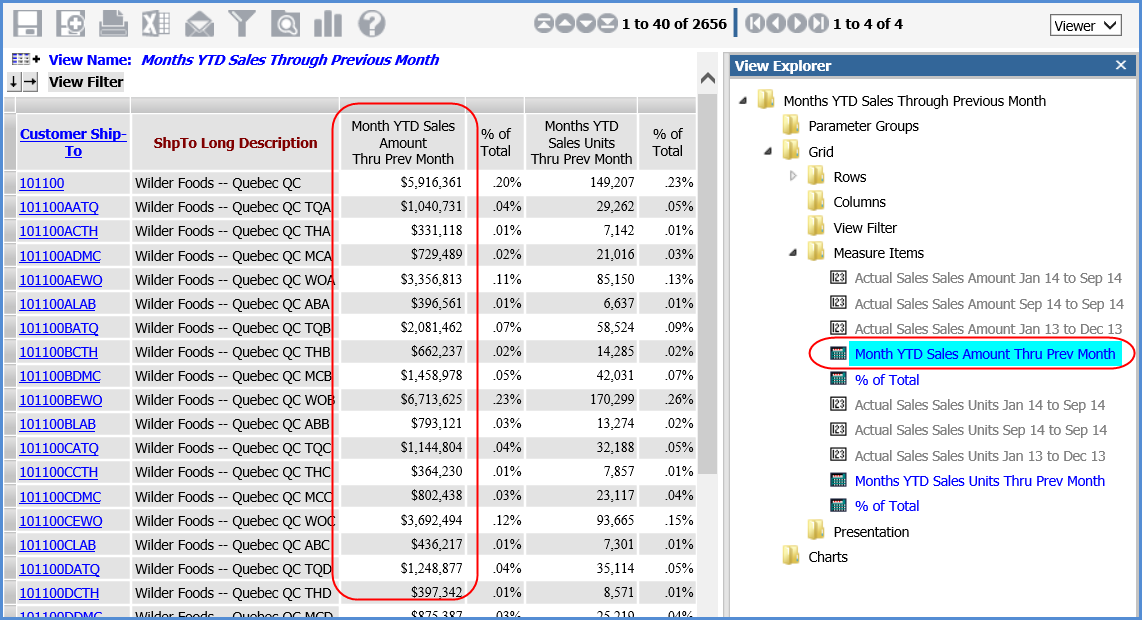
First, three regular measure items were added and then hidden from view. The first regular measure item represents Months YTD sales for the current year.
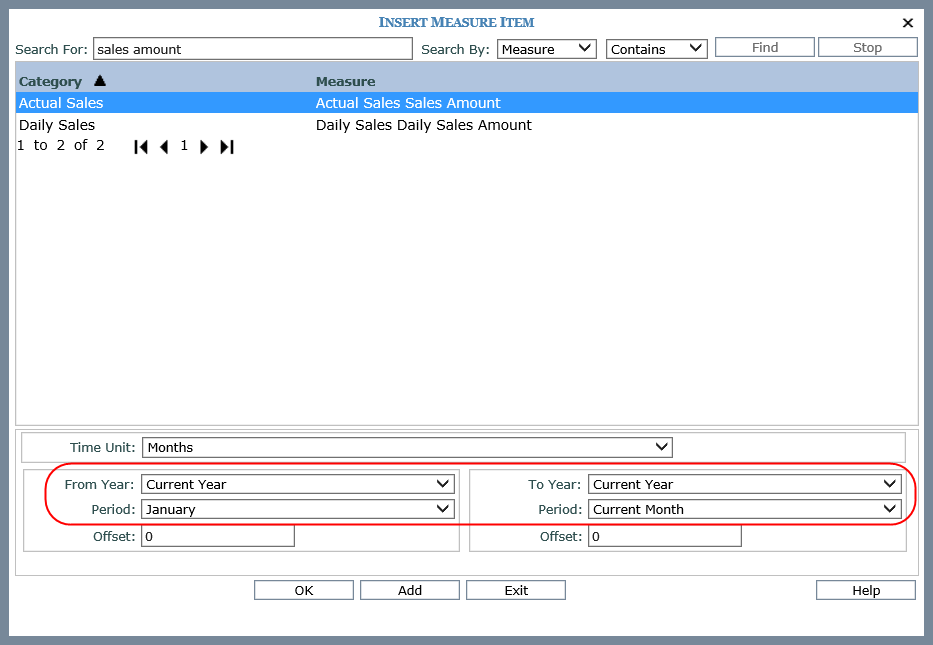
The second regular measure items represents current month sales for the current year.
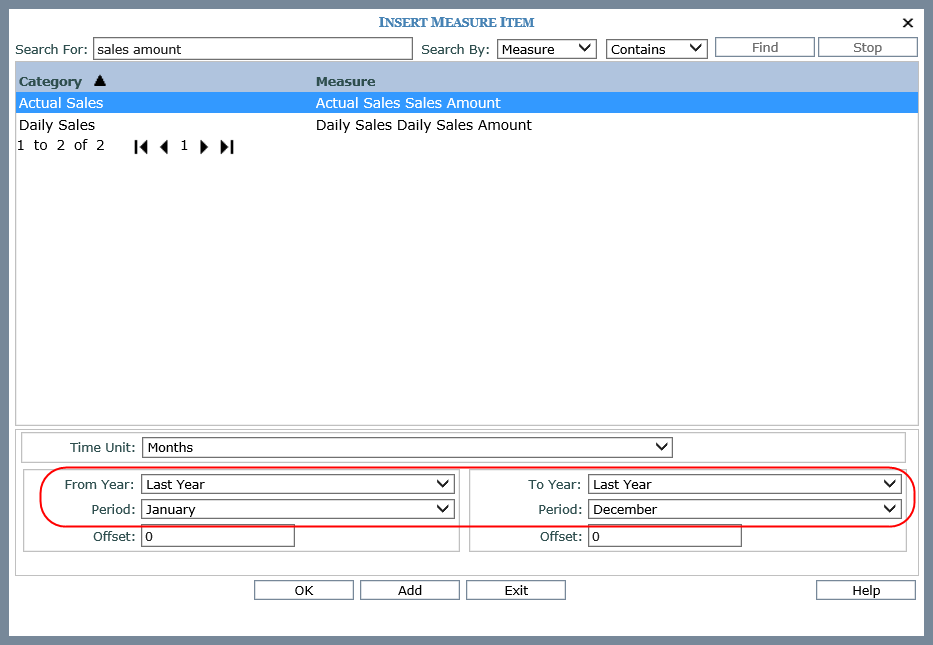
The third measure item represents sales for the first month through the last month of the previous year.
Note: This measure item defines the data for Stratum.Viewer to display when it is the first period of the current year. In this example, we opted for a measure item with a time range of the first period through last period of the previous year. Your company should choose a time range that fits your analysis needs.
Then the regular measures items were hidden and the calculated measure item was added. The calculation checks to see if the current month is January and then proceeds accordingly.
If the current month is not the first month of the year, then subtract the sales for the current month of the current year from the Months YTD current year sales (subtract the second regular measure item from the first regular measure item).
If the current month is the first month of the year, then display sales for the first month through last month of the previous year (display the third regular measure item).
Here is the expression for the calculation (also shown in the next image):
Iif( [Time].[Rolling Months Based].[Months Based].[Current Month].Properties("Rolling Months Based-Months Based-Abs Months")<>"January", [Measures].[Data1 (Actual Sales Sales Amount Jan 14 to Sep 14)] - [Measures].[Data2 (Actual Sales Sales Amount Sep 14 to Sep 14)], [Measures].[Data3 (Actual Sales Sales Amount Jan 13 to Dec 13)])
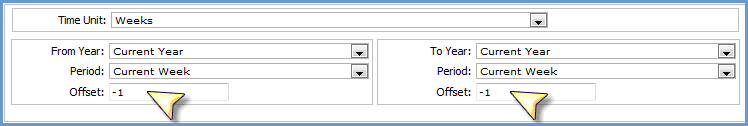
This view shows 12 rolling weeks of sales data, for the current week and 11 prior weeks. In this case, that is Week 38 back to Week 27 of 2014.
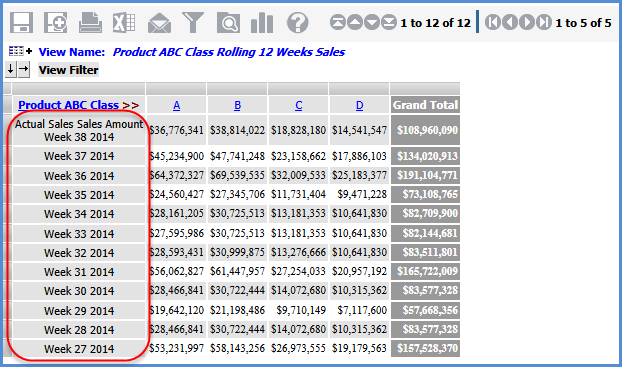
Time range properties for the current week were:
Offsets to the Current Week of the Current Year were used to create the rest of the measure items. For example, the From and To offsets were both set to -1 for the prior week measure item (Week 36), were set to -2 for the 2 weeks ago measure item (Week 35), and so on through using -11 From and To offsets for the 12 weeks ago measure item (Week 26).
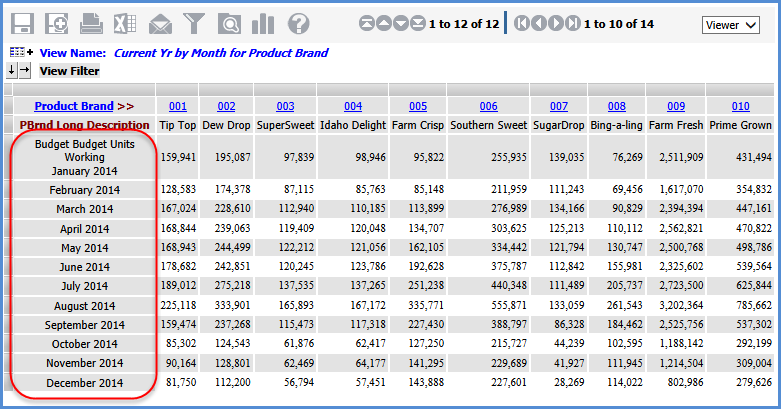
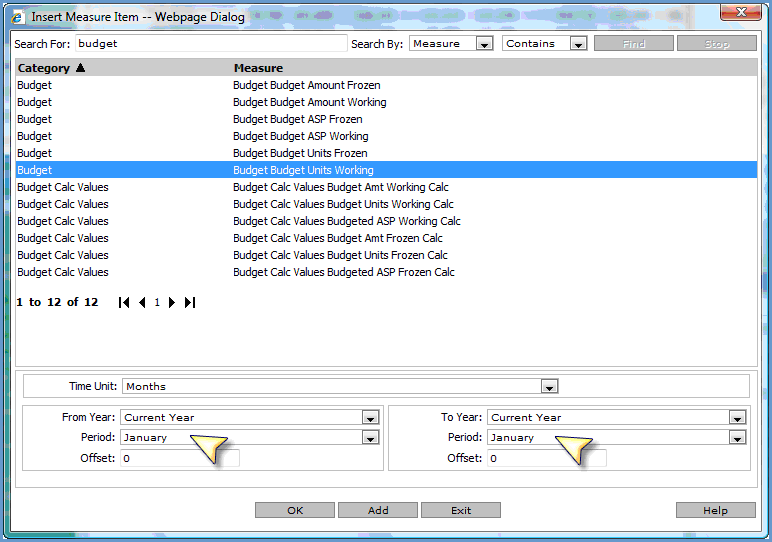
This view shows budget data by month for the current year only – January through December of 2014.
Here are the first measure item’s properties. Subsequent ones were created by changing the month to February, March, April, and so on.
This trending view shows data for the last year and current year by month. That analysis is achieved using Months from the Months hierarchy on rows and Year Based from the Year Based Months Based hierarchy on columns.
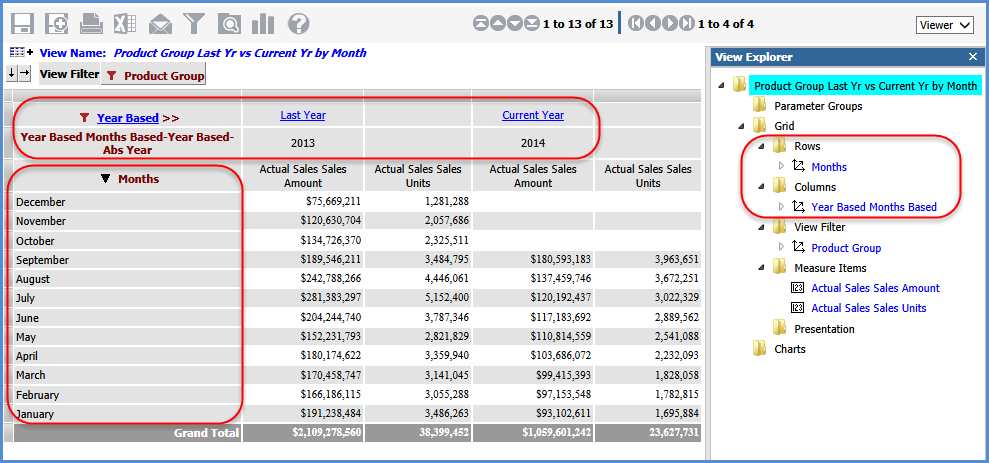
The Time Range property for the view is No, so the measure items don’t have any time range properties.
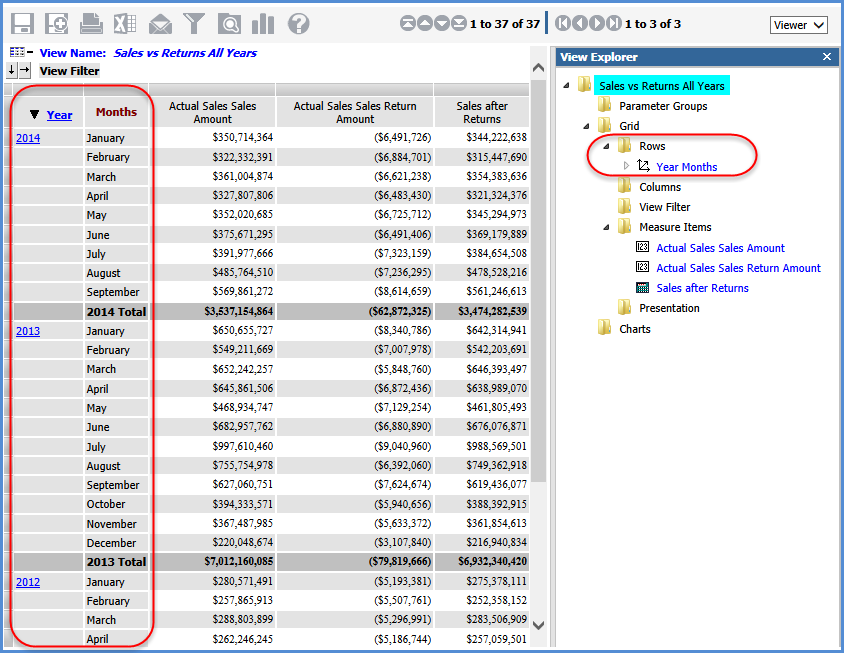
This trending view shows data for all years by month for sales and returns. That analysis is achieved using the Year Months hierarchy on rows, drilled down to Months. As with the previous example, measure items without time ranges are used in the view. A calculated measure item shows net sales after returns.