The way data gets imported to the various dimensions in your Stratum environment is influenced by a few things, including what dimension values were in the import source and what dimensions you mapped to during import set up. Read on to learn about what you can expect to see in Stratum when you look at your imported data.
Note: More details about what influences placement of imported data are in the Examples section of this Data Import help. If you have questions about where data ends up, review the processing report for an import. It summarizes how measures and dimensions were mapped and shows the source of data for each dimension associated with the import’s Target category.
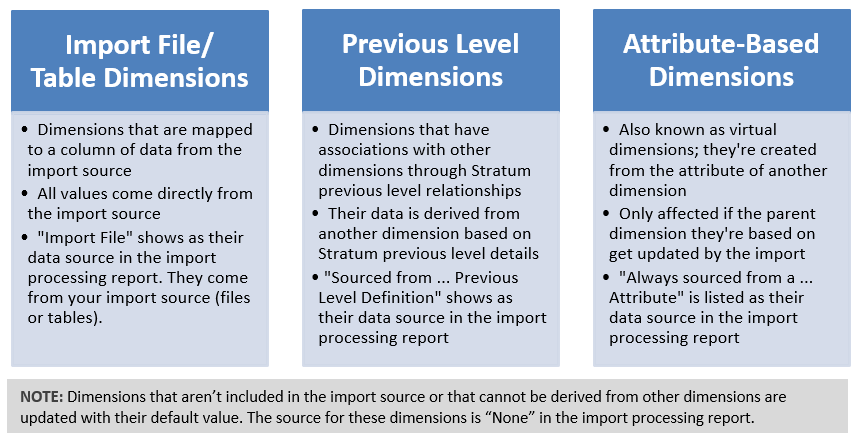
Here’s how dimensions can be impacted by an import and which of its values will be impacted. An example and more details follow this graphic.
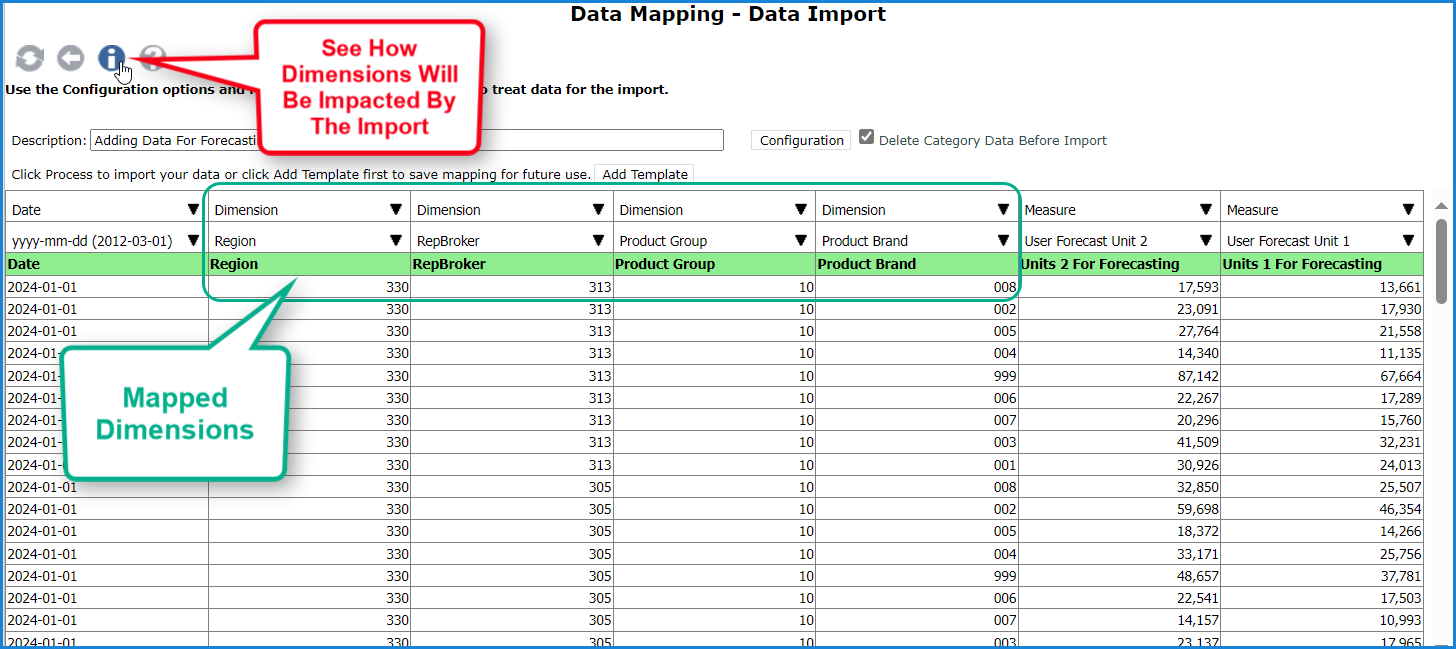
The import shown in the next image has four dimensions in its Excel import file. All were mapped to Stratum dimensions. Their imported data will come directly from values in the Excel import file. The second image shows you the Data Import Information window for this import. That window is accessed from the Data Mapping window and shows how the import will treat various dimensions.
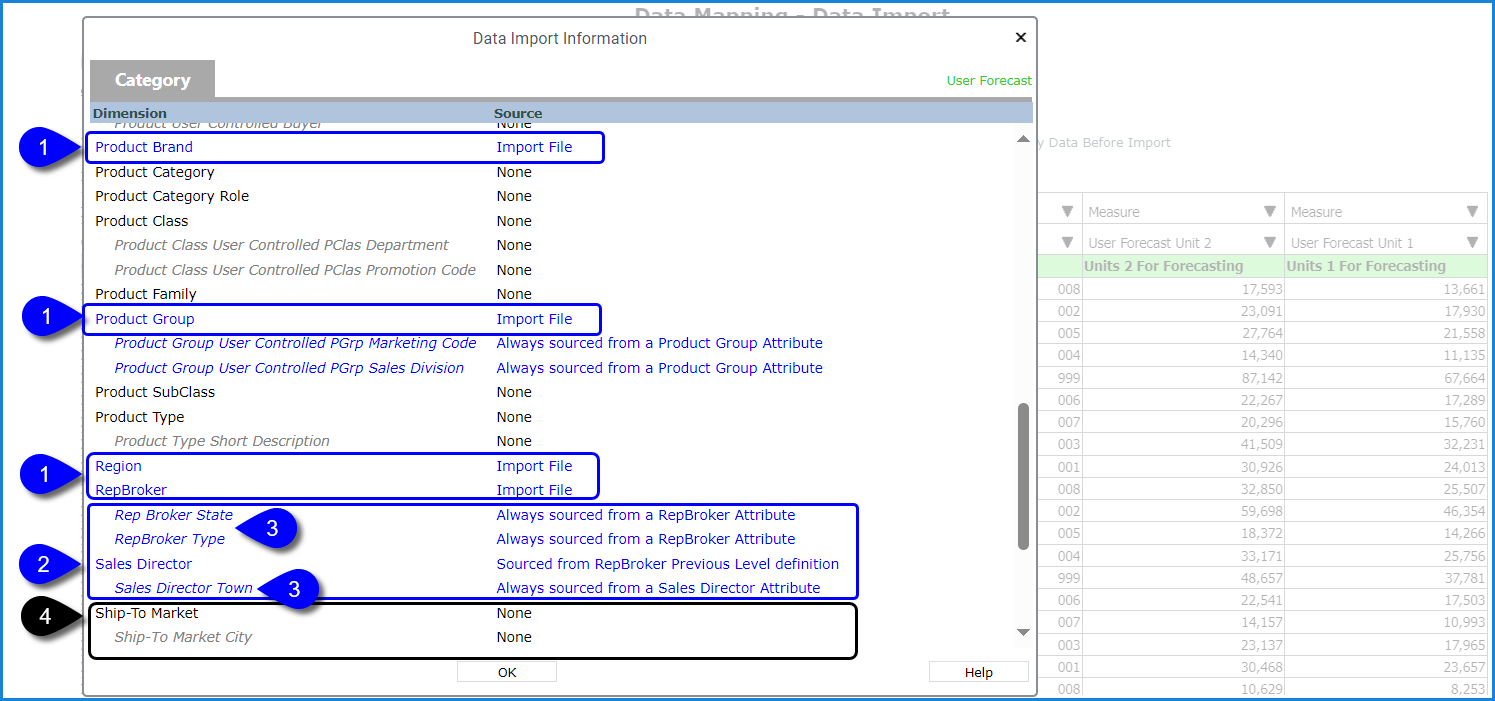
Here’s some things you can see in the Category window:
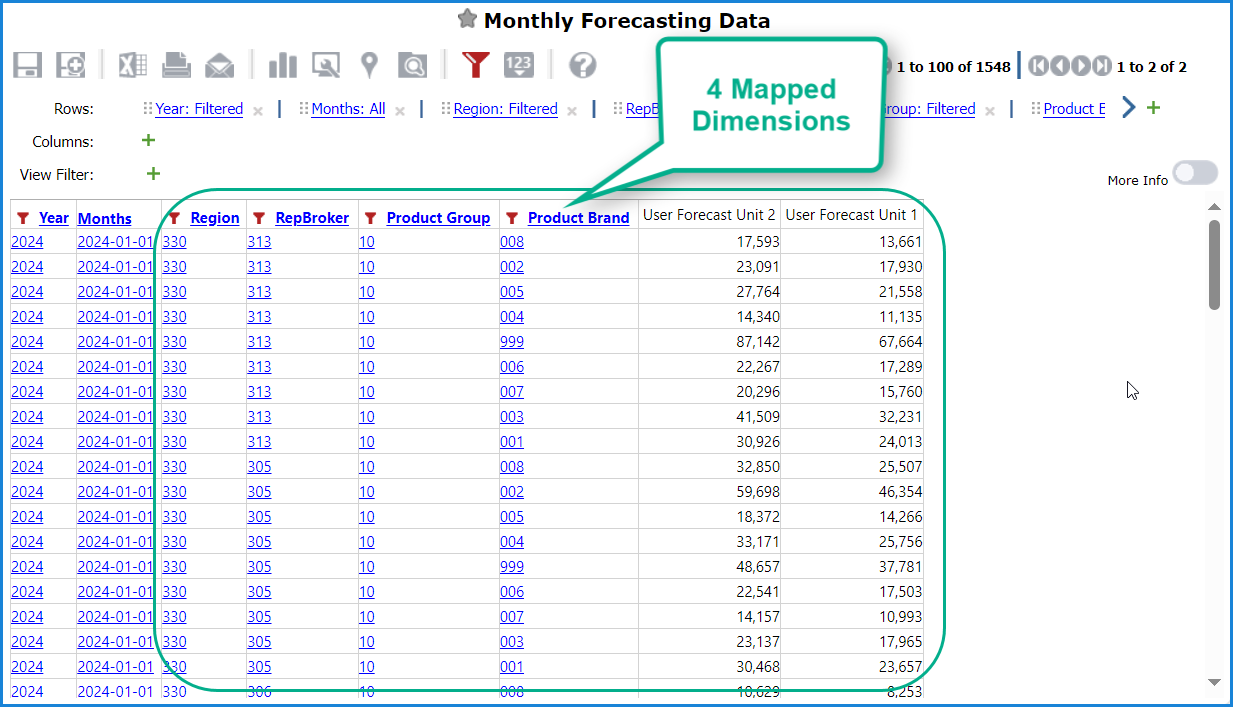
1. Product Brand, Product Group, Region, and RepBroker are the mapped dimensions.
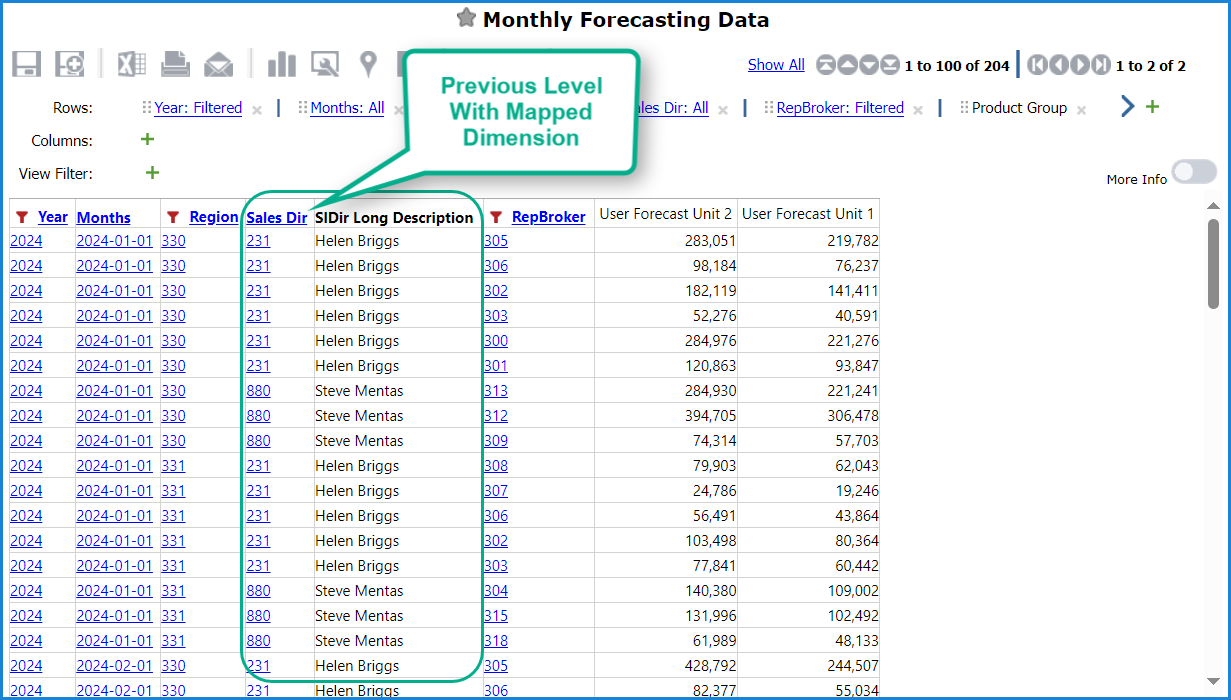
2. Sales Director is a dimension with previous level associations to one of the mapped dimensions.
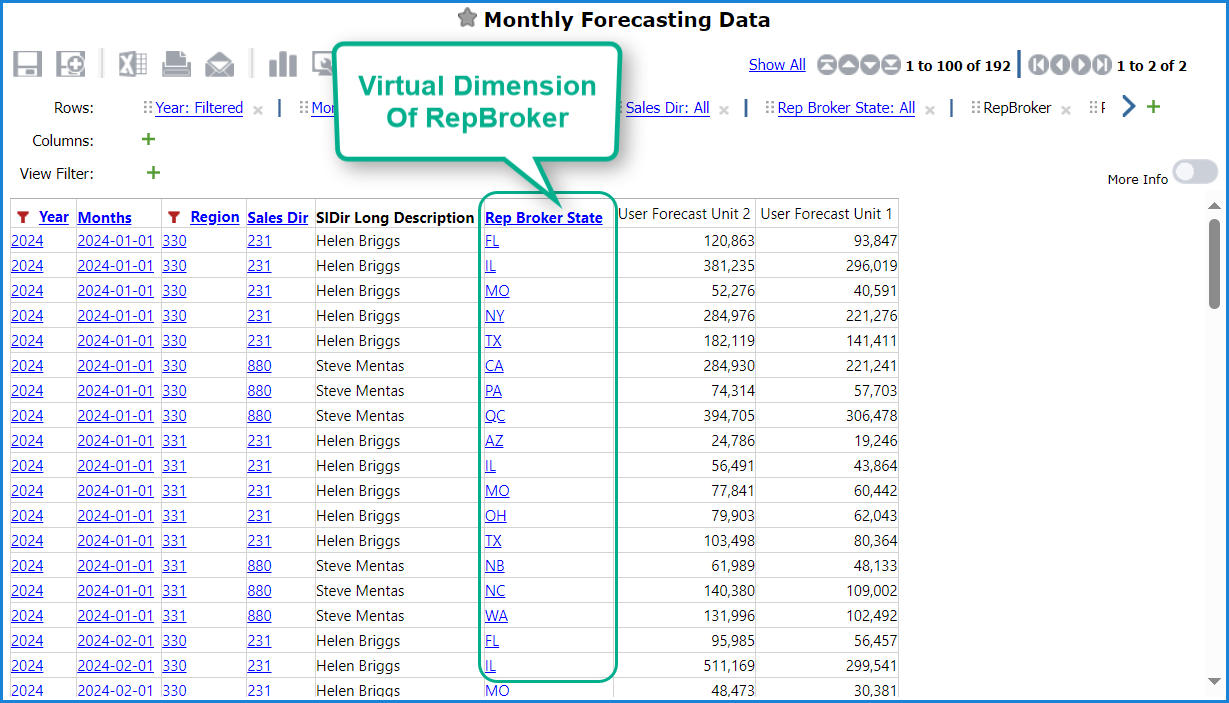
3. RepBroker State and RepBroker Type are virtual dimensions, based on attributes of the mapped RepBroker dimension. Sales Director Town is a virtual dimension based on an attribute of Sales Director.
4. Ship-To Market is one of many dimensions that have a None designation, meaning import data cannot be derived from the Excel import file, previous level relationship, or from a parent dimension’s attribute. Therefore, all data will only show up for its default value.
The last few images in this topic show you how imported data looks in Viewer views when the aforementioned dimensions are visible in the view.
Here’s the view when mapped dimensions are on display. The Region, RepBroker, Product Group and Product Brand data came from the import file.
Here’s the view when the Sales Director dimension is on display. The Sales Director data was created from the Rep Broker | Sales Directory previous level information.
Here’s the view adjusted to show the RepBroker State virtual dimension of the RepBroker mapped dimension. Rep Broker State data was created from the Rep Broker’s State attribute.
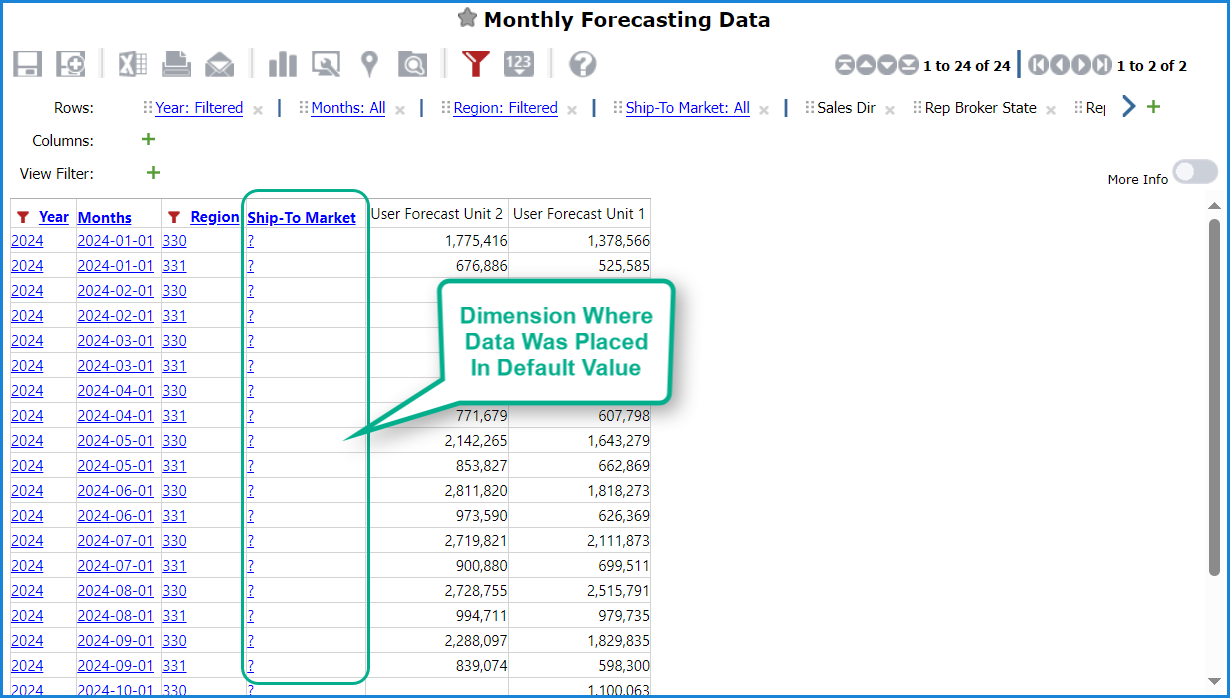
And here’s a view with the Ship-To Market dimension on display in rows. That dimension wasn’t in the import file and Data Import couldn’t derive values from any previous level associations to other dimensions. Data only shows for the Ship-To Market’s “?” default value.