User-curated data housed in Excel spreadsheets can be imported directly into the Stratum Data hub via Viewer’s Data Import. It’s well suited for bringing demographics, budgets and plans, market trends, weather, and other outside data that compliments your core, enterprise data into the hub. Immediately see the imported data in Stratum for centralized analysis with the rest of your business data.
Data Import empowers everyday users – helping them accomplish analyst and citizen data scientist tasks without needing to have IT expertise or deep knowledge of the Stratum database. Data Import is launched from the Analyst Tools menu of Stratum.Viewer. The Data Mapping window guides you through configuring and importing data. The new data is immediately available to use in your views.
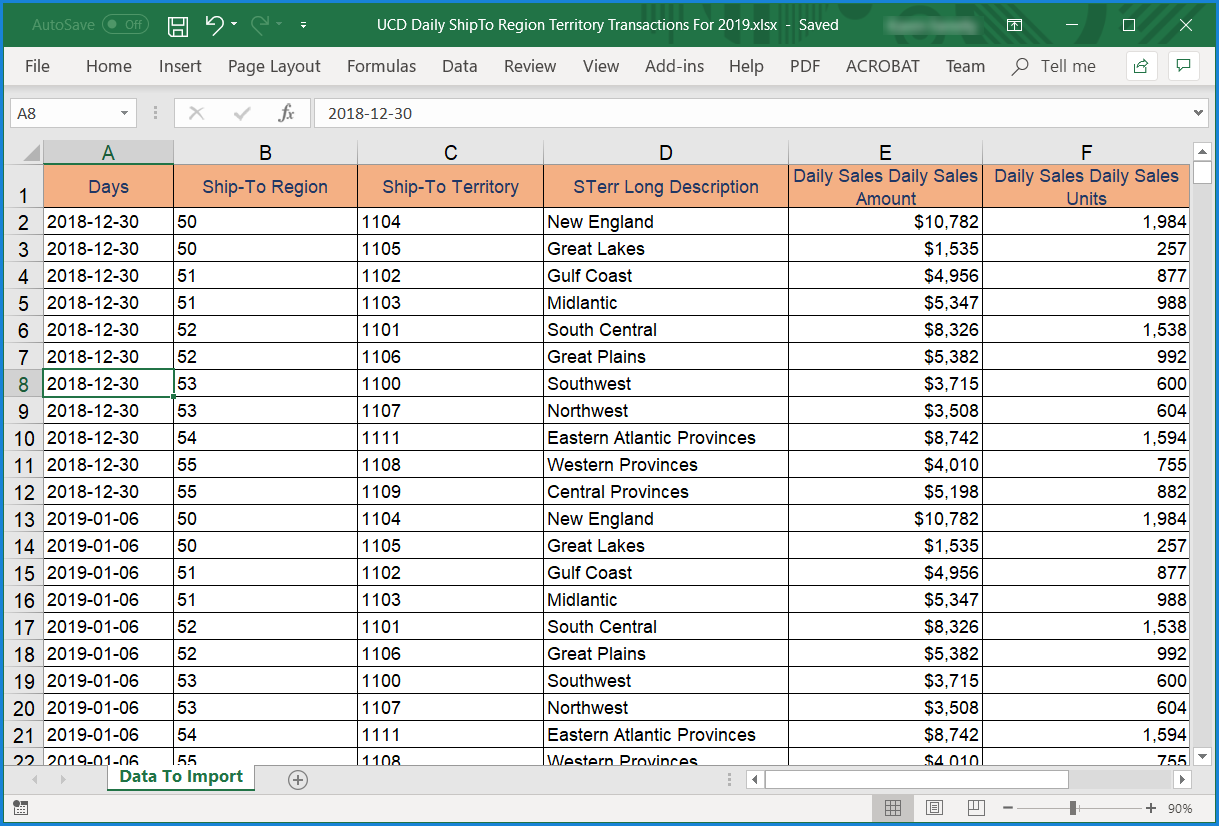
In the following example, data from a Daily Sales category is being used to populate measures in a Point Of Sales (POS) category. The data starts off in an Excel spreadsheet with the date, dimension, and measure data for the import.
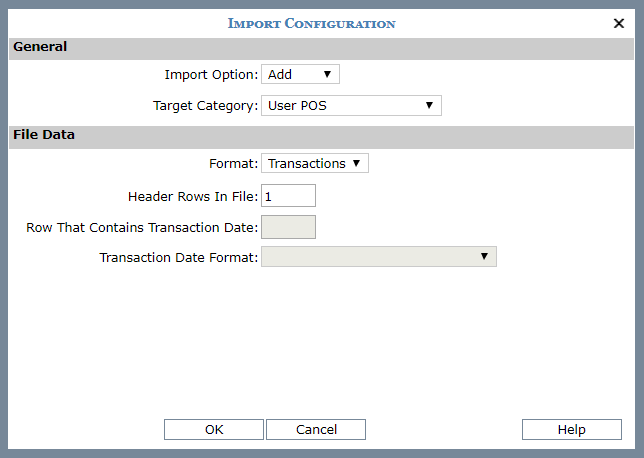
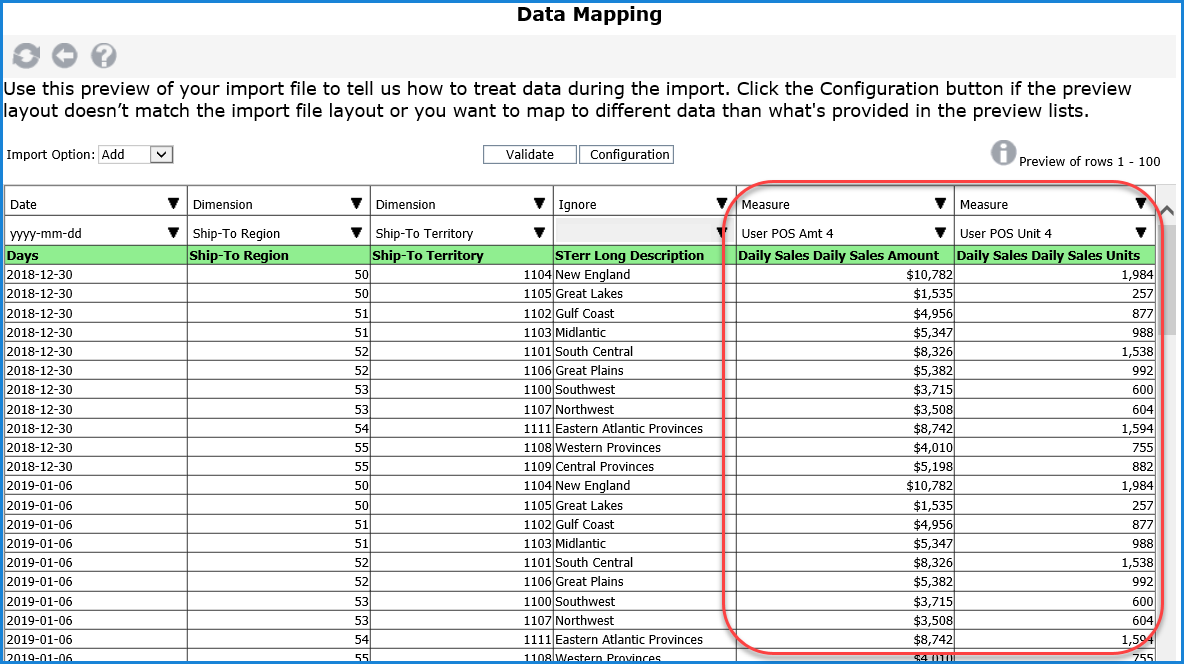
A configuration and mapping window have properties that tell Viewer what to do with the data.
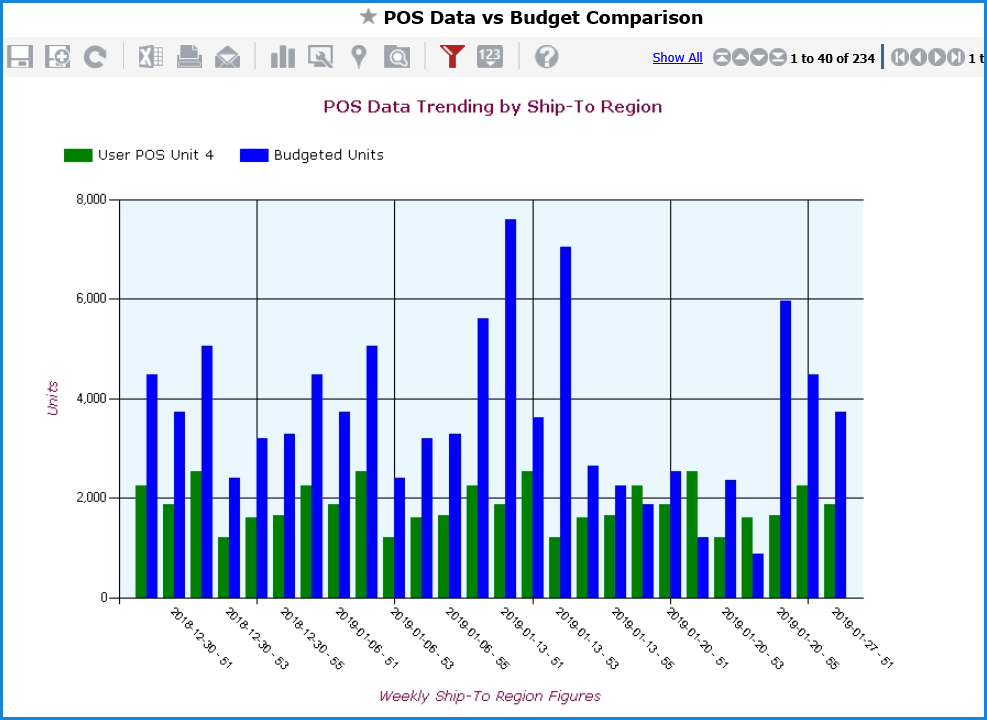
The imported data is available immediately in Viewer to build our Stratum views and graphs. Here, some of it’s been used to create a chart to analyze POS unit trends in comparison to Budgeted units.