 .
.1. Access the Chart Data Wizard in one of two ways:
Click the Add Charts
icon  .
.
OR
Right-click anywhere in the view grid. From the pop-up menu, choose Add then Chart.
2a. In the Chart Data Wizard (Step 1 of 3) - Series window, choose the chart type, whether series are from rows or columns, three dimensional, and dynamic or static. If series are dynamic, you also have the option of including Total and All Others data. See Chart Data Wizard (Step 1 of 3) – Series.
2b. If
you selected series to be static, options display to select the values
for the series. Click Add to open an additional selection window. See
Chart
Data Wizard (Step 1b of 3) – Static Series.
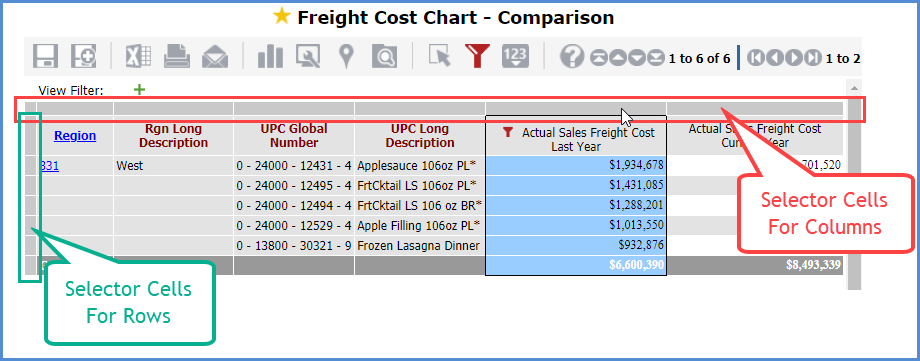
Highlight each row or column that you want to be the series by clicking
their selector cell in the grid. For rows, the selector cell is the blank
cell space to the left edge of it in the grid. For columns, the selector
cell is the blank cell space above the column at the top of the grid.
After making your selections in the grid, click Select in the chart wizard
then click Done.

3a. Click Next to define the chart’s data points. In the Chart Data Wizard (Step 2 of 3) – Data Points window, choose whether the data points are dynamic or static. If data points are dynamic, you also have the option of including Total and All Others data. See Chart Data Wizard (Step 2 of 3) – Data Points.
3b. If
you selected data points to be static, options display to select the values
for the data points. Click Add to open an additional selection window.
See Chart
Data Wizard (Step 2b of 3) – Static Data Points.
Highlight
each row or column that you want to be the data points by clicking their
selector cell in the grid. For rows, the selector cell is the blank cell
space along the left edge of it in the grid. For columns, the selector
cell is the blank cell space above the column at the top of the grid.
After making your selections in the grid, click Select in the chart wizard
then click Done.

4. Click Next to define the style of the chart’s title, axes, and legend.
5. Click Finish.
Note: Once the chart is created, you can further customize the chart.