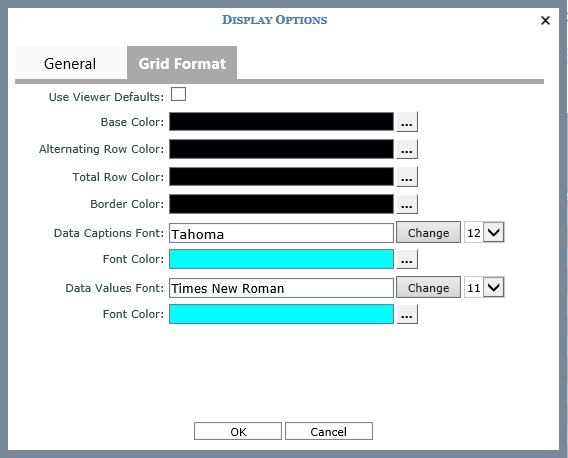
Grid formatting tools aid you in designing reports with a professional appearance. Control the look of different parts of the grid, adjusting them to set up reports with color schemes that match your company’s brand identify or to create looks that aid in visibility as users access reports. Adjust the Font Color, Border Color, Base Color, and colors for Total or Alternating Rows to create a look that uniquely suits the purpose of the report and your design preferences. A few examples of looks that can be achieved with different combinations of grid formatting options are shown below.
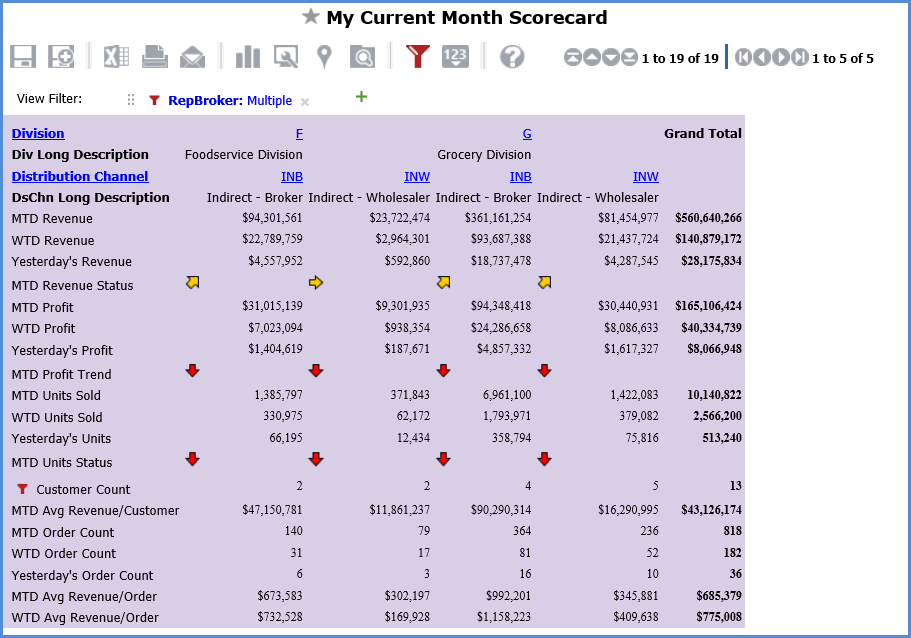
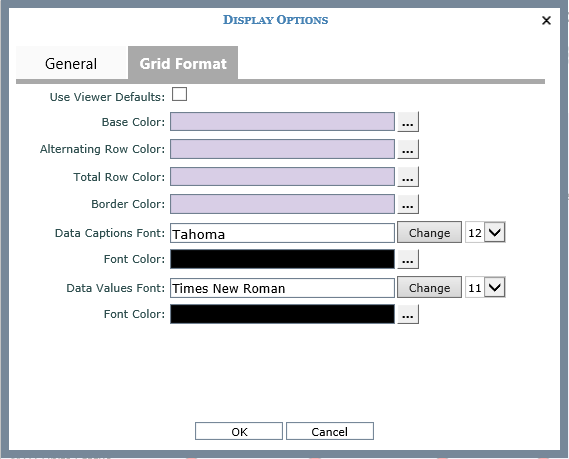
This view uses the same color for the Border, Base, Alternating Row, and Total Row Colors. A larger size font has been used for data captions compare to data values.
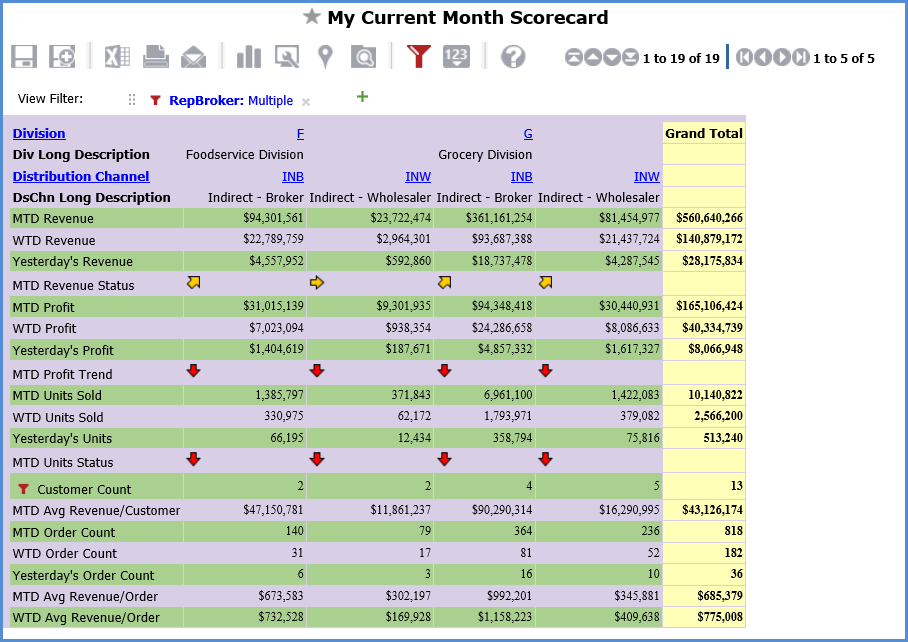
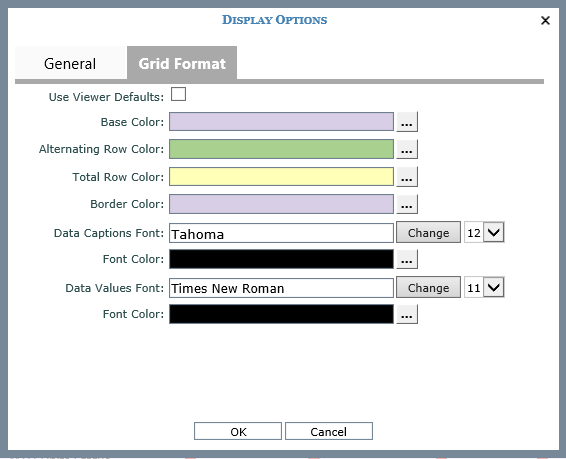
Here’s the same view updated to use different colors for the Alternating and Total Row Colors.
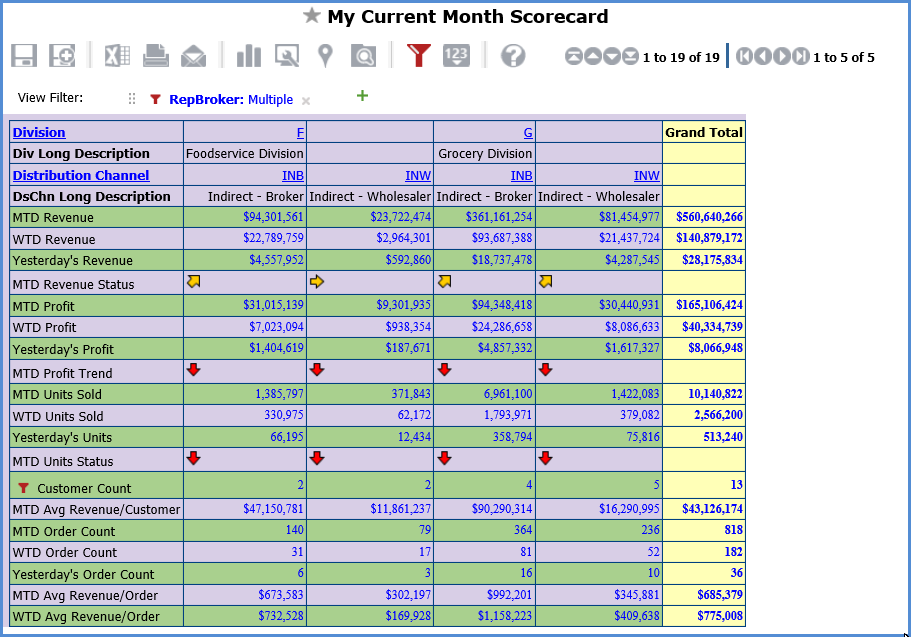
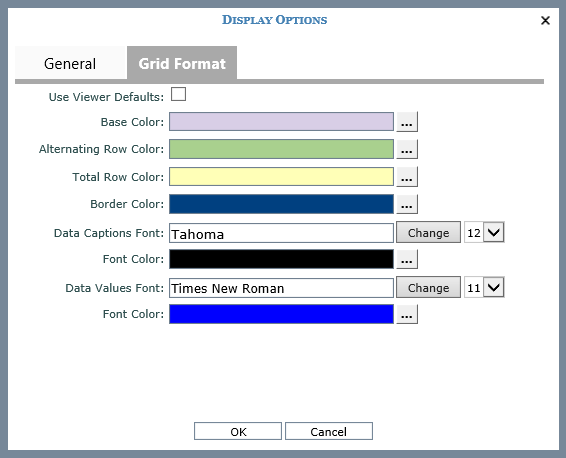
More adjustments are made to the view, this time using a Border Color that makes the border stand out more and changing the Font Color for the data values.
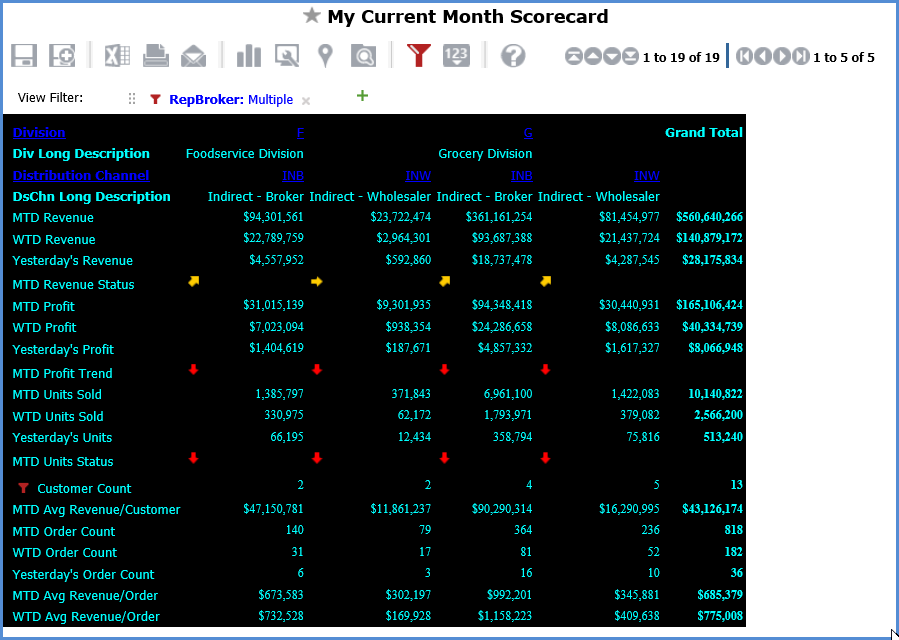
Then, a more dramatic set of changes is made to create a high contrast look for the view. Darker colors are selected for the Border, Base, Alternating Row, and Total Row colors. The fonts are all changed to a bright blue.
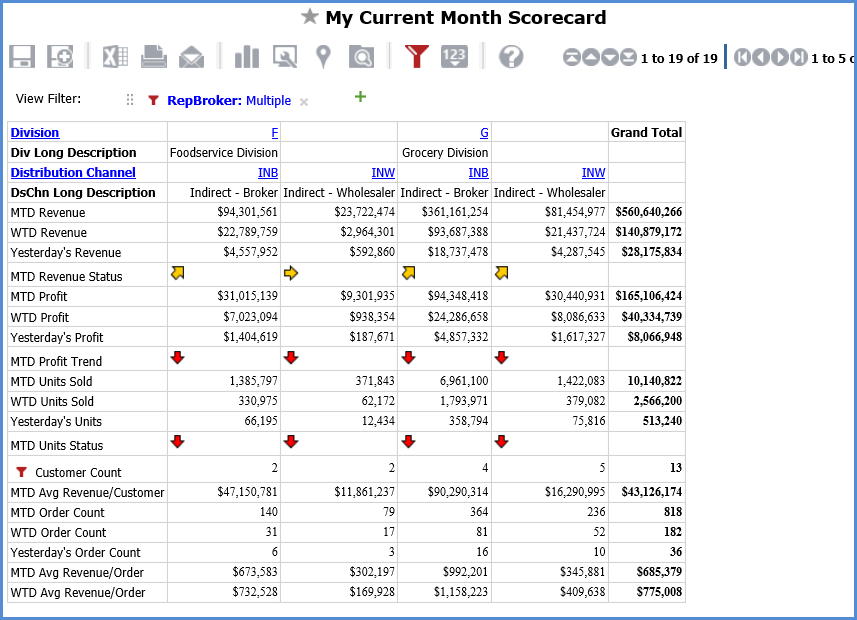
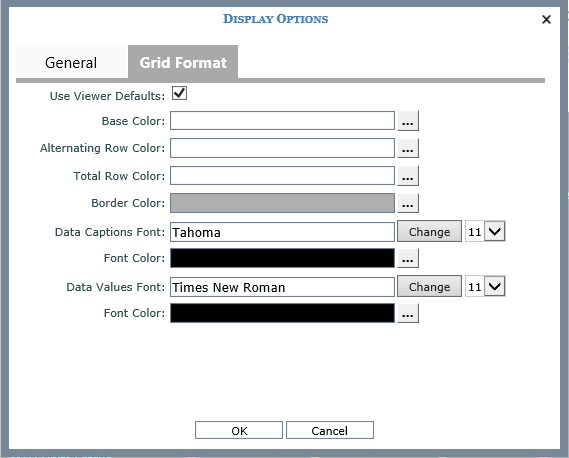
Finally, the user sets the formatting properties to Use Viewer Defaults. This setting adjusts the grid to use the default view look that the Viewer administrator has set up for the application.