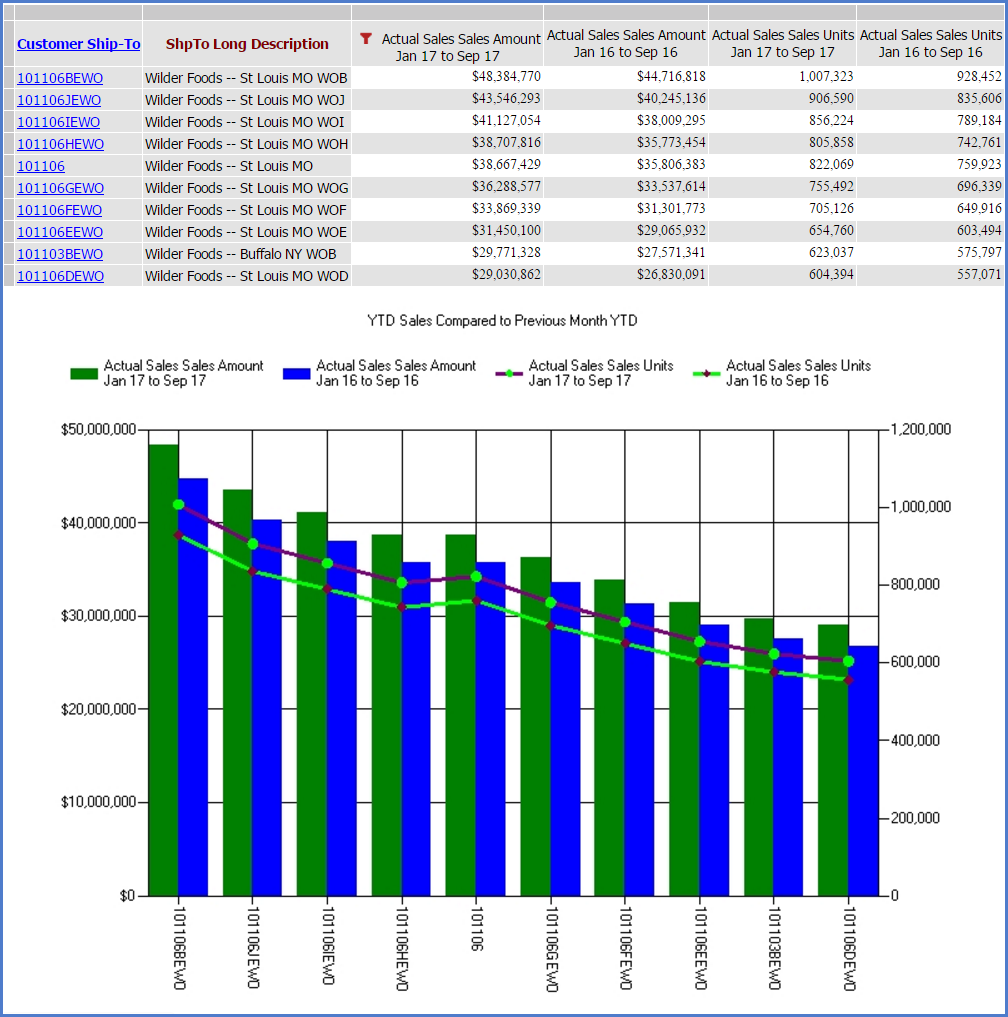
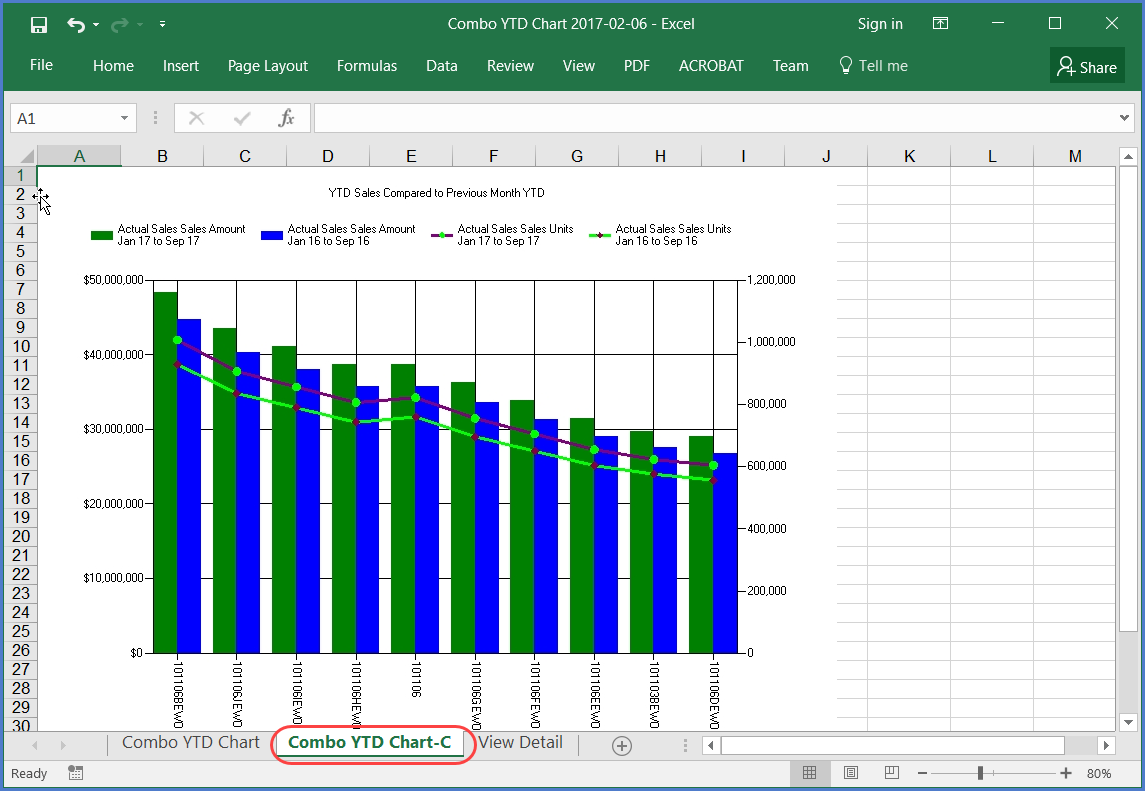
These examples show how view data is exported to Excel. This view has both a grid and a chart included.
The file name contains the view name and date of the export. The grid is displayed starting in the first cell of the Excel worksheet. The worksheet that contains the contents of the grid is named using up to the first 27 characters of the view name. All rows and columns of the view are exported. If the grid is not visible in the view, then it will not be included in the export file.
Note: When exporting view data into Excel, only the values, images, and conditional formatting will be brought into the workbook. For example, any sorted or filtered data in the view will be carried over in that state to the worksheet but the Stratum.Viewer sort and filter functionality and icons will not be carried over. You will need to use Excel sort and filter functionality if you want to modify the data further in the worksheet. Any value such as subtotals, grand totals, calculated measures, etc, will not be a formula but simply the value displayed within Stratum.Viewer.
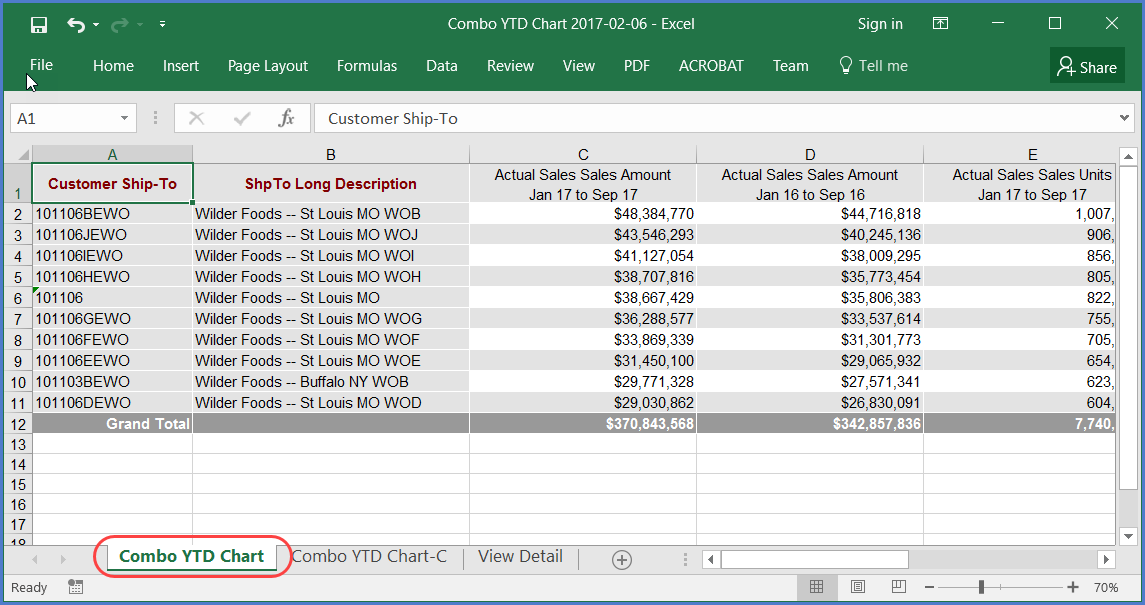
The worksheet that contains the charts associated with the view is named using up to the first 27 characters of the view name followed by a dash mark and the letter ‘C’. The chart is an embedded image in a separate worksheet and displays the identical size of the chart(s) in the view. If there were more than one chart, they would all display as one image on the chart worksheet.
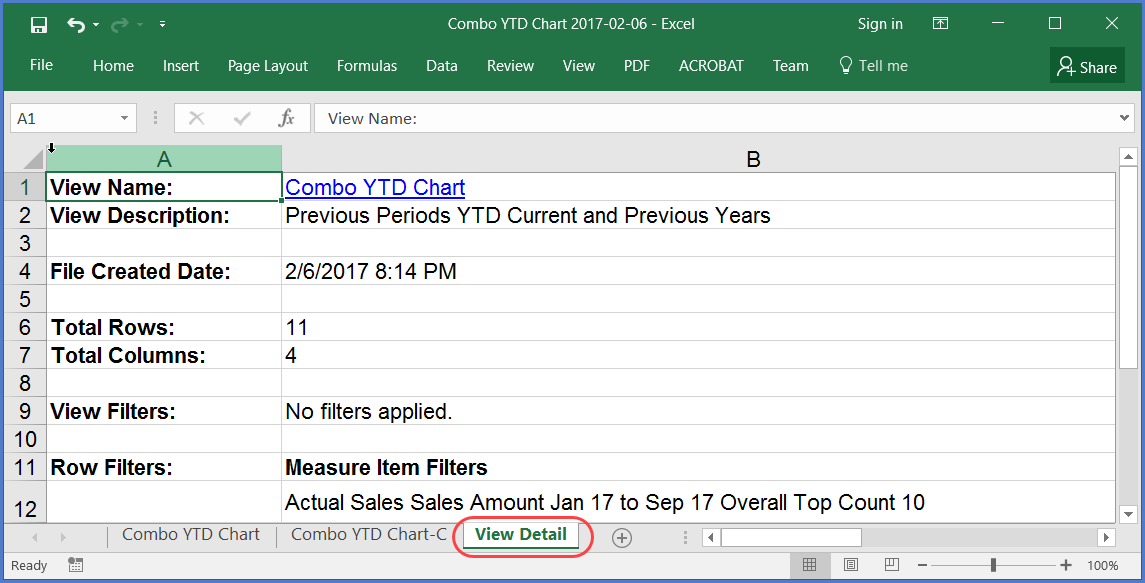
The last worksheet is named View Detail. A link to the view and basic properties are listed on this worksheet. Details include the name, total number of rows and columns, filters (View filter, rows, columns, measure items), and sorts.