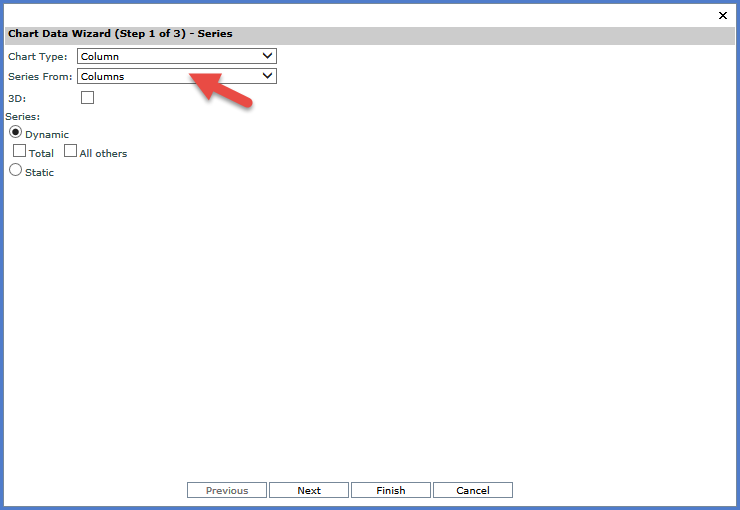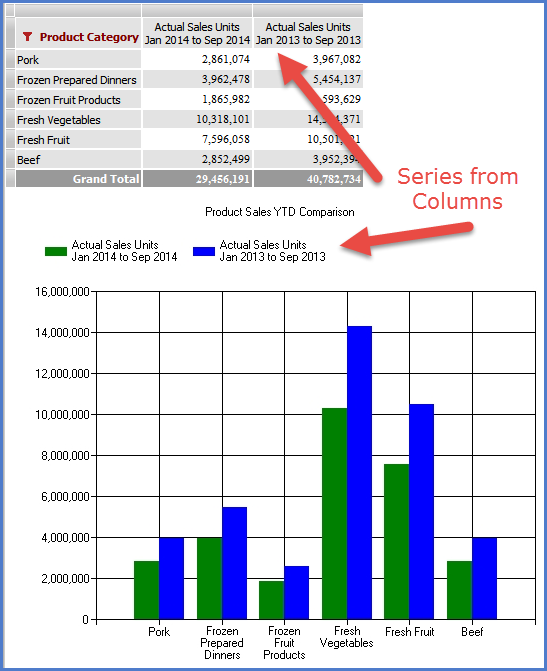
Series are a group of related items (data points) that are included in a chart. Series can be created from either the rows or columns of the grid. In this chart, the Series, Actual Sales Units 2014 and Actual Sales Units 2013 are from the columns of the grid. The data points, Fresh Vegetables, Pork, Beef, Fresh Fruit, Frozen Fruit Products, and Frozen Prepared Dinners are from the rows of the grid.