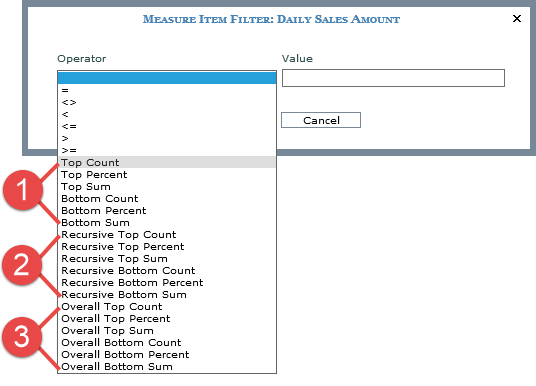
Measure item filters in Stratum.Viewer include sets of predefined Stratum filters – Top / Bottom, Recursive Top / Bottom, and Overall Top / Bottom. They can be applied as a Count, Sum, or Percent filter. They are meant to be used in views with multiple levels where you have drilled down through levels by header (which is done by clicking on level names). Examples in the next section illustrate how the different types of filters behave in views.
1. Top and Bottom – A filter that is applied only to the most detailed subtotal level displayed in a view. You will see the top or bottom performers at that subtotal level in relation to every member that’s on display in every prior level.
2. Recursive Top / Bottom – A filter that is applied to all subtotal levels displayed in a view and that takes into account the top or bottom performing members from all prior levels.
3. Overall Top / Bottom – A filter that is applied at the most detailed level displayed in a view to give you the overall top performers based on all the levels displayed.
Predefined Stratum filters are intended to be used in views where multiple levels exist on the axis opposite of measure items. In the following examples, measure items are on columns so the filters will impact levels on rows.
We will drill down on levels by header in the following examples to illustrate the difference between various predefined Stratum filters. Drilling down by header is done by clicking the names of levels in these multi-level views.
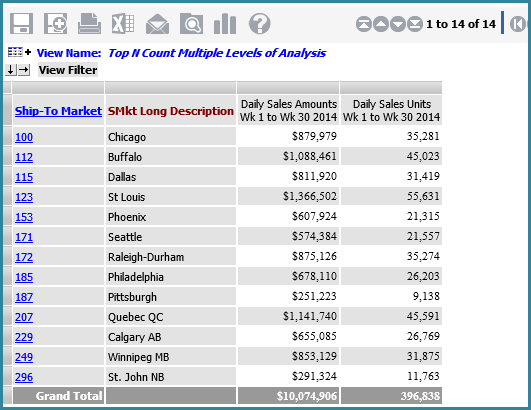
Here is a view with no filtering applied to its measure items and no other levels drilled to yet.
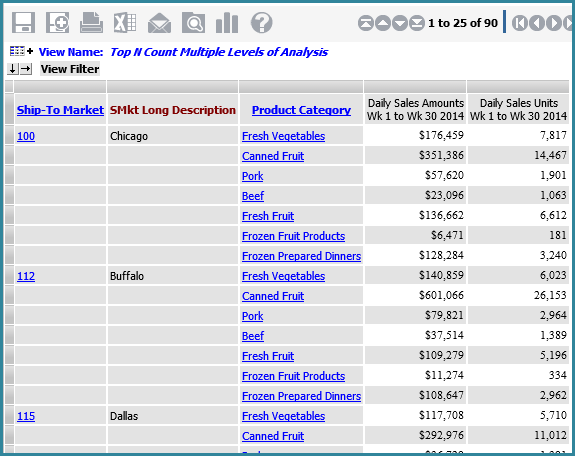
The next image shows the view after drilling down by header to the Product Category level. All of the Product Categories for all Ship-To Markets are displayed.
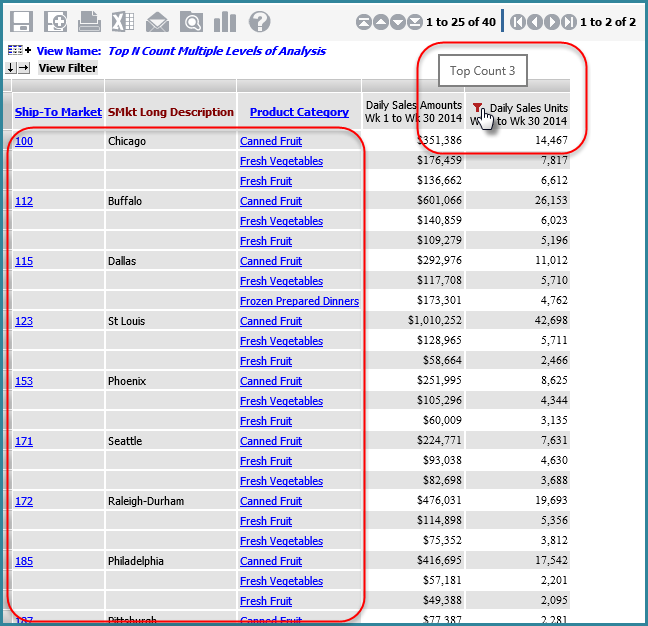
See the next three images for illustrations of how the view results will vary depending on whether a Top, Recursive, or Overall Count filter was applied to the view.
Here’s what the view looks like after applying a Top 3 Count filter to Daily Sales Units. Since Top Count filters are applied only to the most detailed subtotal level displayed in a view, only the top 3 Product Categories for every Ship-To Market are displayed.
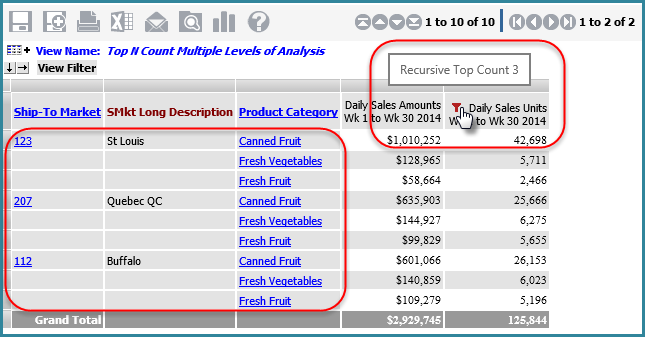
Here’s what the view looks like when you change the filter to a Recursive Top 3 Count. Since Recursive Count filters are applied to all subtotal levels displayed in a view, only the top 3 Product Categories from each of the top 3 Ship-To Markets are displayed.
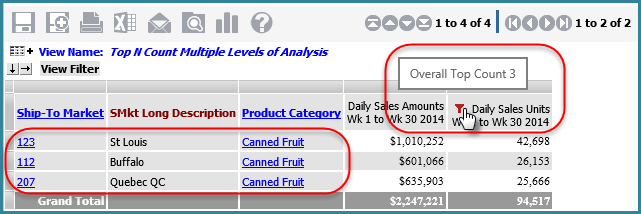
Here’s what the view looks like when you change the filter to an Overall Top 3 Count. Since Overall Top Count filters are applied to only the most detailed level displayed in the view, only the top 3 Ship-to Market/Product Category combinations in terms of overall sales units are displayed.
Here is a view with no filtering applied to its measure items and no other levels drilled to yet.
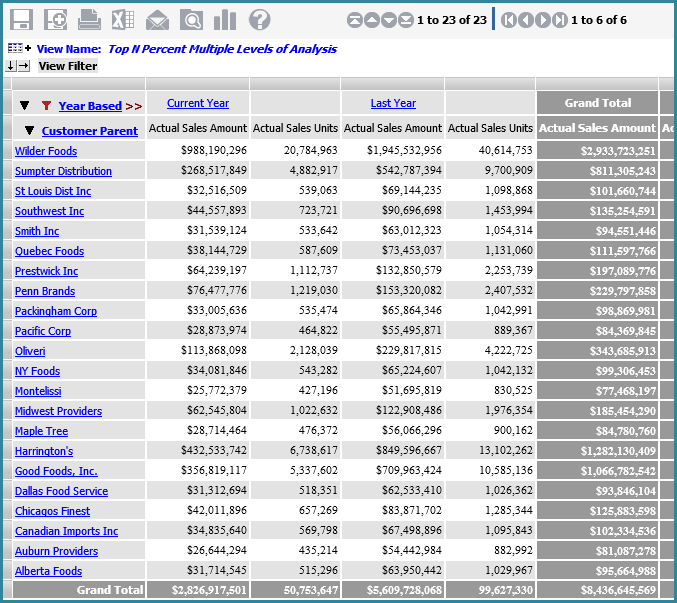
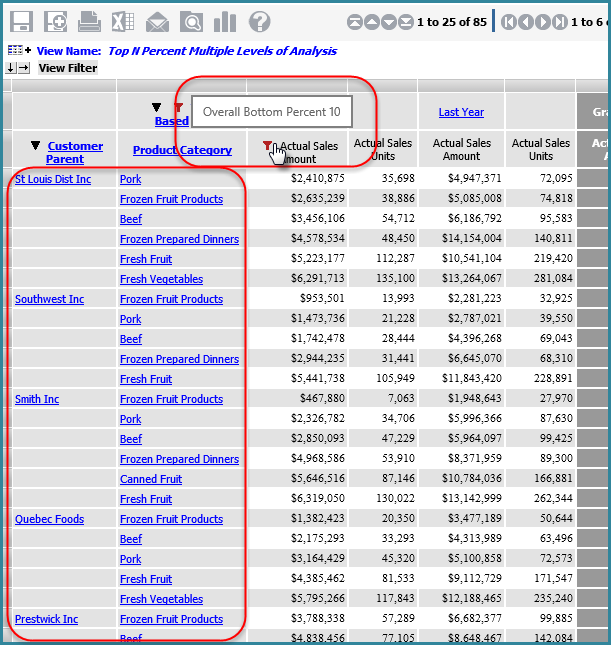
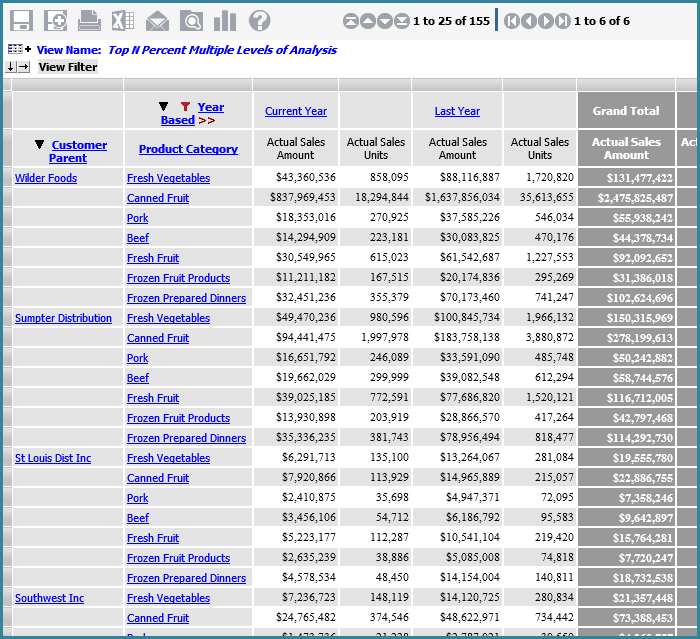
The next image shows the view after drilling down by header to the Product Category level. All of the Product Categories for all Customer Parents are displayed.
See the next three images for illustrations of how the view results will vary depending on whether a Bottom, Recursive, or Overall Percent filter was applied to the view.
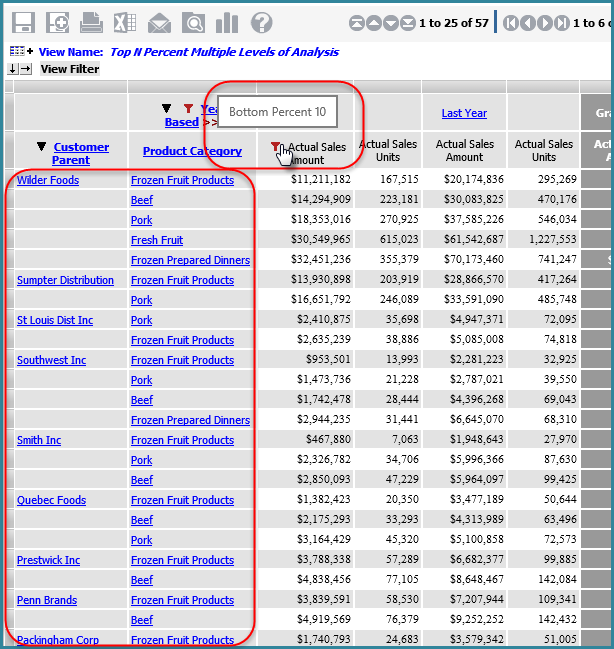
Here’s what the view looks like after applying a Bottom 10 Percent filter to Actual Sales Amount. The bottom 10% of Product Categories for every Customer Parent is displayed. The Bottom Percent filter was applied only to the most detailed subtotal level, Product Category.
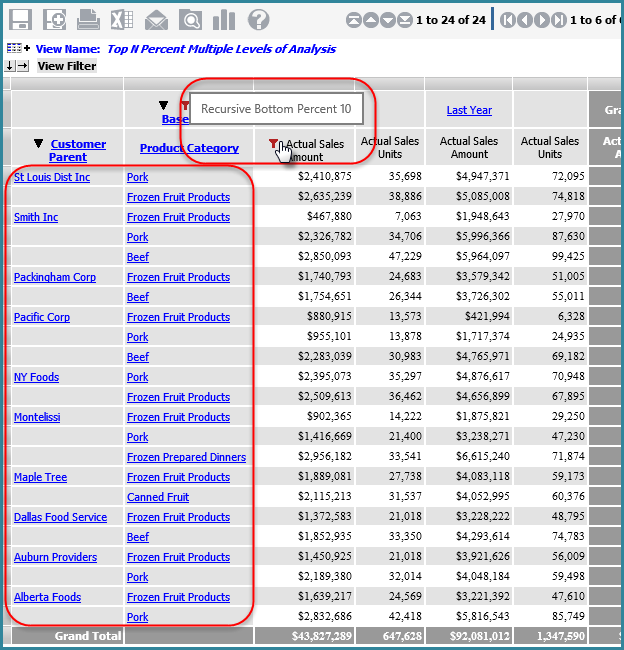
Here’s what the view looks like when you change the filter to a Recursive Bottom 10 Percent. The bottom 10% of Product Categories from each of the bottom 10% of Customer Parents is displayed. The Recursive Bottom Percent filter was applied to each level, Customer Parent and Product Category.
Here’s what the view looks like when you change the filter to an Overall Bottom 10 Percent. Only the bottom 10% of Customer Parent/Product Category combinations in terms of overall sales amount is displayed.